VWAP & Standard Deviations
A dynamic institutional benchmark that reveals mean reversion, trend strength, and volatility expansion.
VWAP (Volume‑Weighted Average Price) represents the true average price traded throughout the session, weighted by real volume. It is one of the most widely used institutional benchmarks, helping traders understand whether price is trading above or below fair value. Combined with standard deviation bands, VWAP becomes a powerful tool for identifying trend strength, volatility expansion and potential mean‑reversion opportunities.
These levels provide a clean, objective framework for evaluating directional conviction, locating premium and discount zones, and anticipating where price may revert, stall or accelerate.
VWAP Line
A dynamic fair‑value anchor based on real traded volume.
VWAP represents the average price traded throughout the session, weighted by actual volume. Unlike a simple moving average, VWAP reacts only to real participation: large trades shift it more than small ones, making it a reliable institutional benchmark for fair value.
The VWAP line updates continuously as new trades arrive. It remains stable during quiet periods and adjusts smoothly during high‑volume bursts, giving you a clean and trustworthy reference for trend strength, pullbacks and liquidity zones.
VWAP Modes
| Mode | Description |
|---|---|
| Session VWAP | Tracks the volume‑weighted average price for the entire trading session. |
| Live Updating VWAP | Updates tick by tick to reflect current institutional fair value. |
| Minimalist VWAP | Draws a thin, unobtrusive line for low‑noise layouts. |
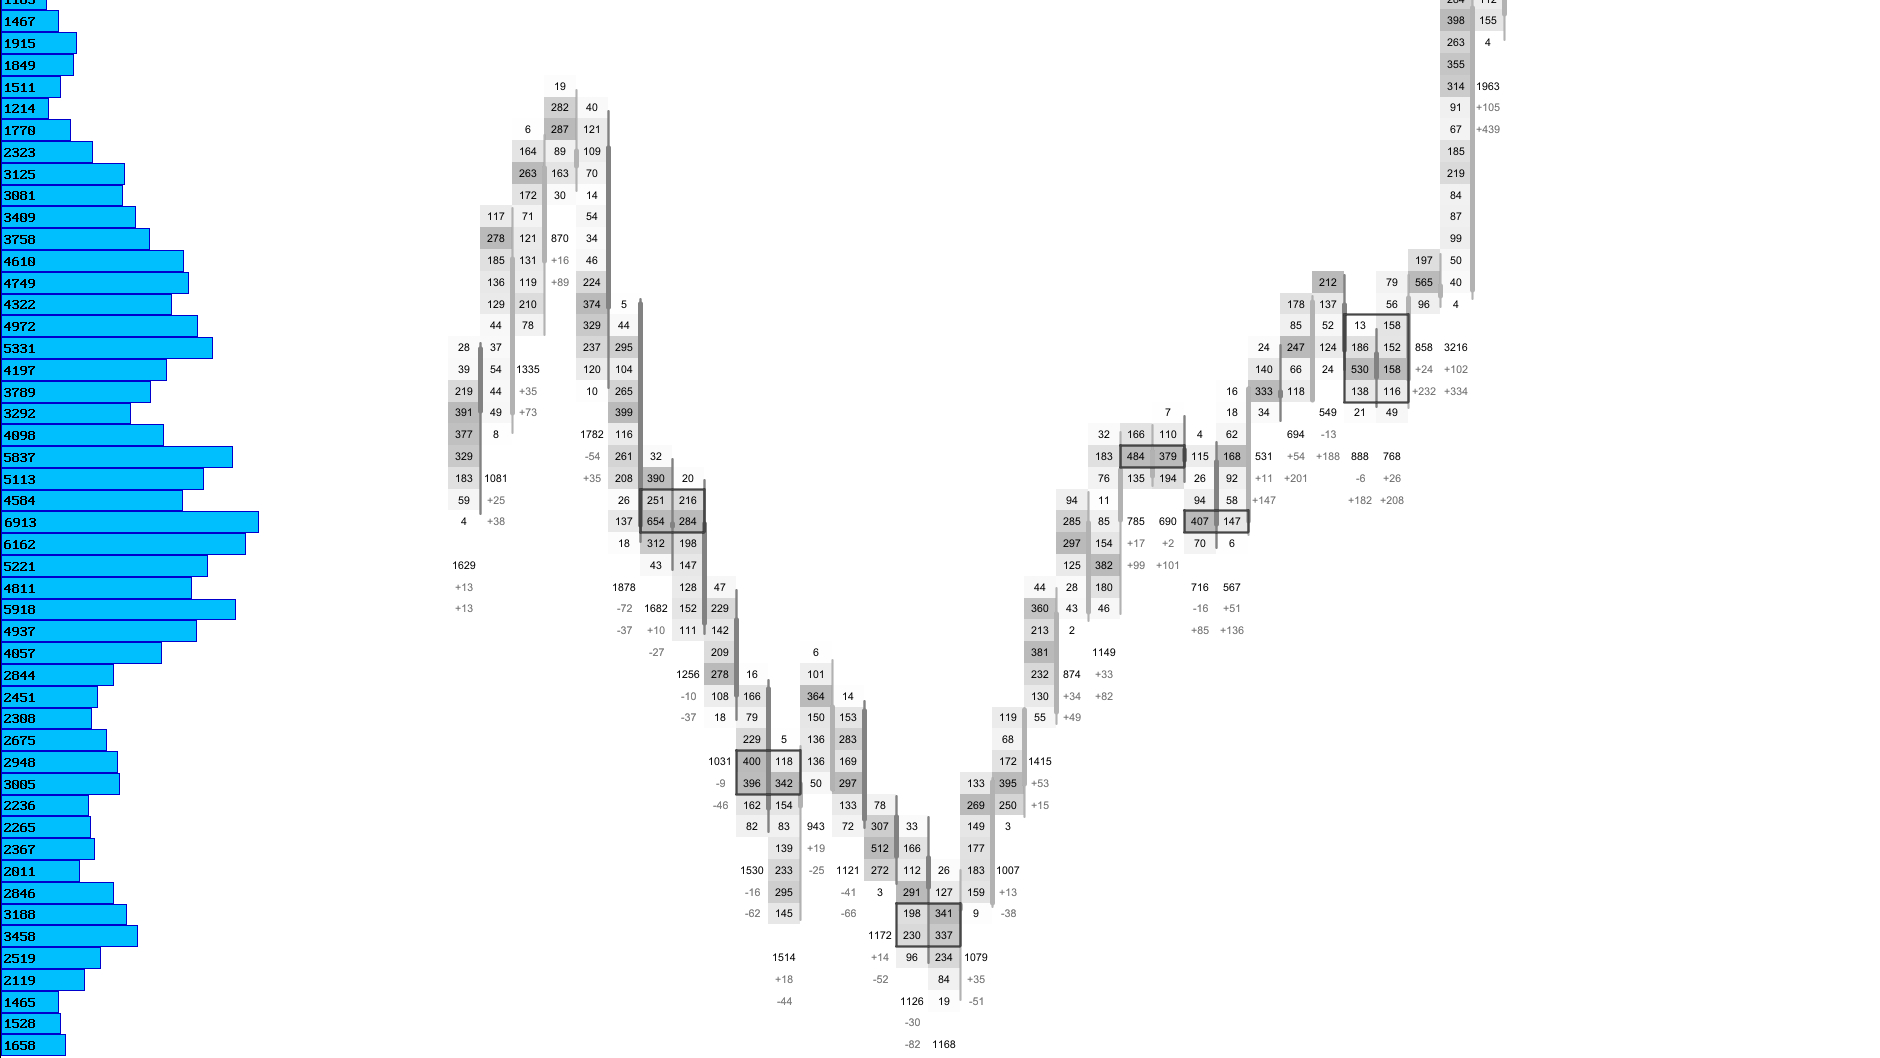
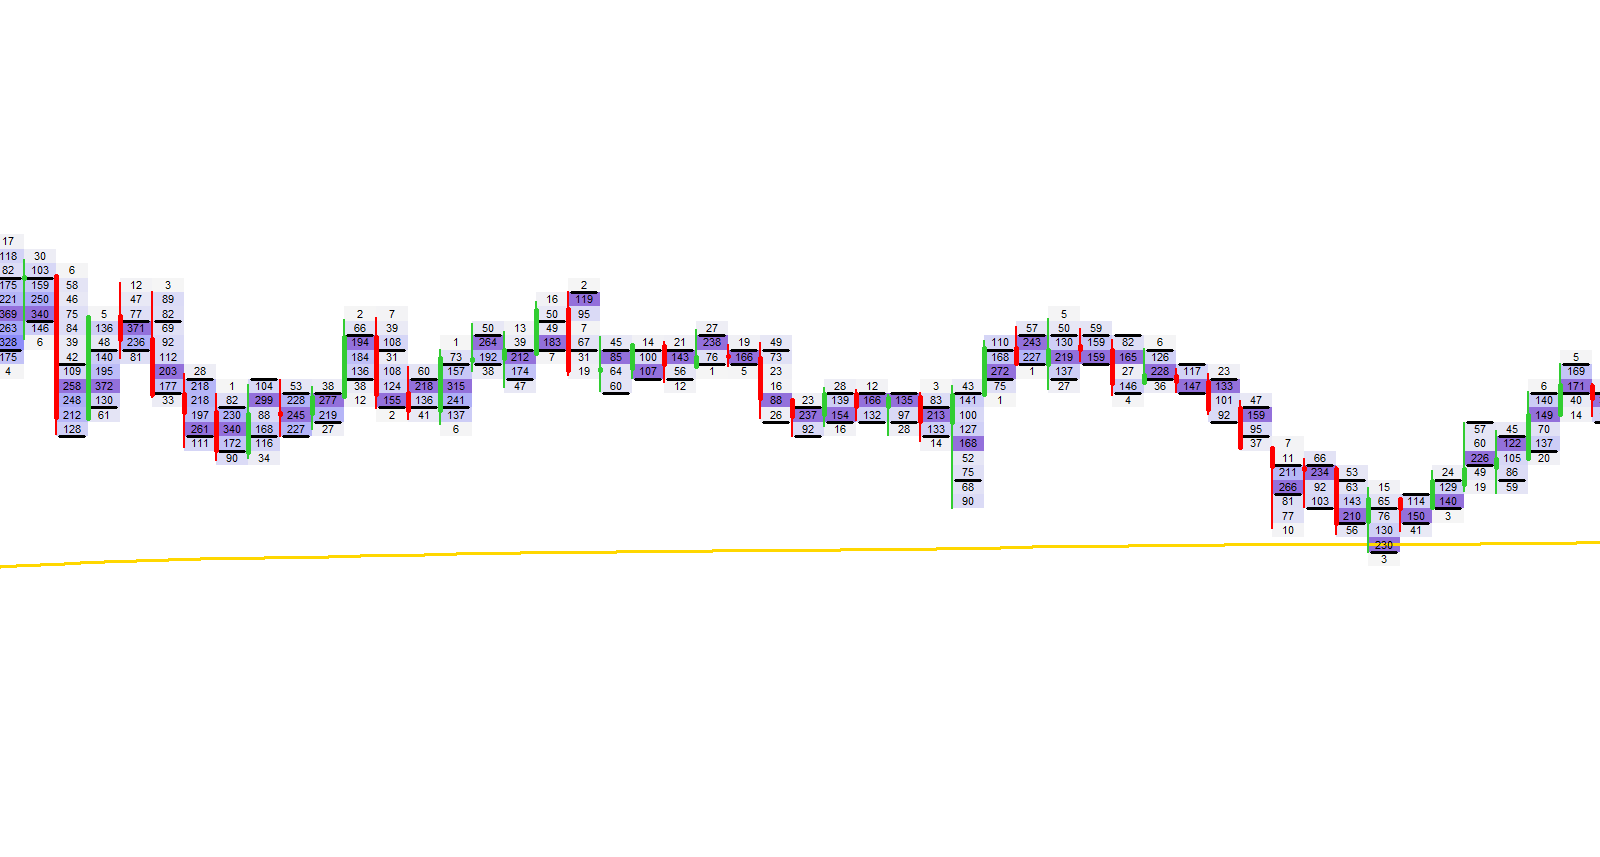
Visual Example: VWAP Line
Standard Deviations
Volatility bands that reveal expansion, compression and extremes around VWAP.
Standard deviation bands measure how far price deviates from VWAP based on the session’s volume‑weighted volatility. The first band often acts as a dynamic balance zone, while the second and third bands highlight statistically stretched conditions.
These bands help you identify when price is trading at fair value, when it is extended, and when mean‑reversion or continuation is more likely. Because they are volume‑weighted, they adapt naturally to changing market conditions without requiring manual tuning.
Standard Deviation Band Modes
| Mode | Description |
|---|---|
| ±1 SD Bands | Defines the primary balance zone around VWAP. |
| ±2 SD Bands | Highlights extended but still tradable extremes. |
| ±3 SD Bands | Marks statistically rare extremes and potential exhaustion zones. |
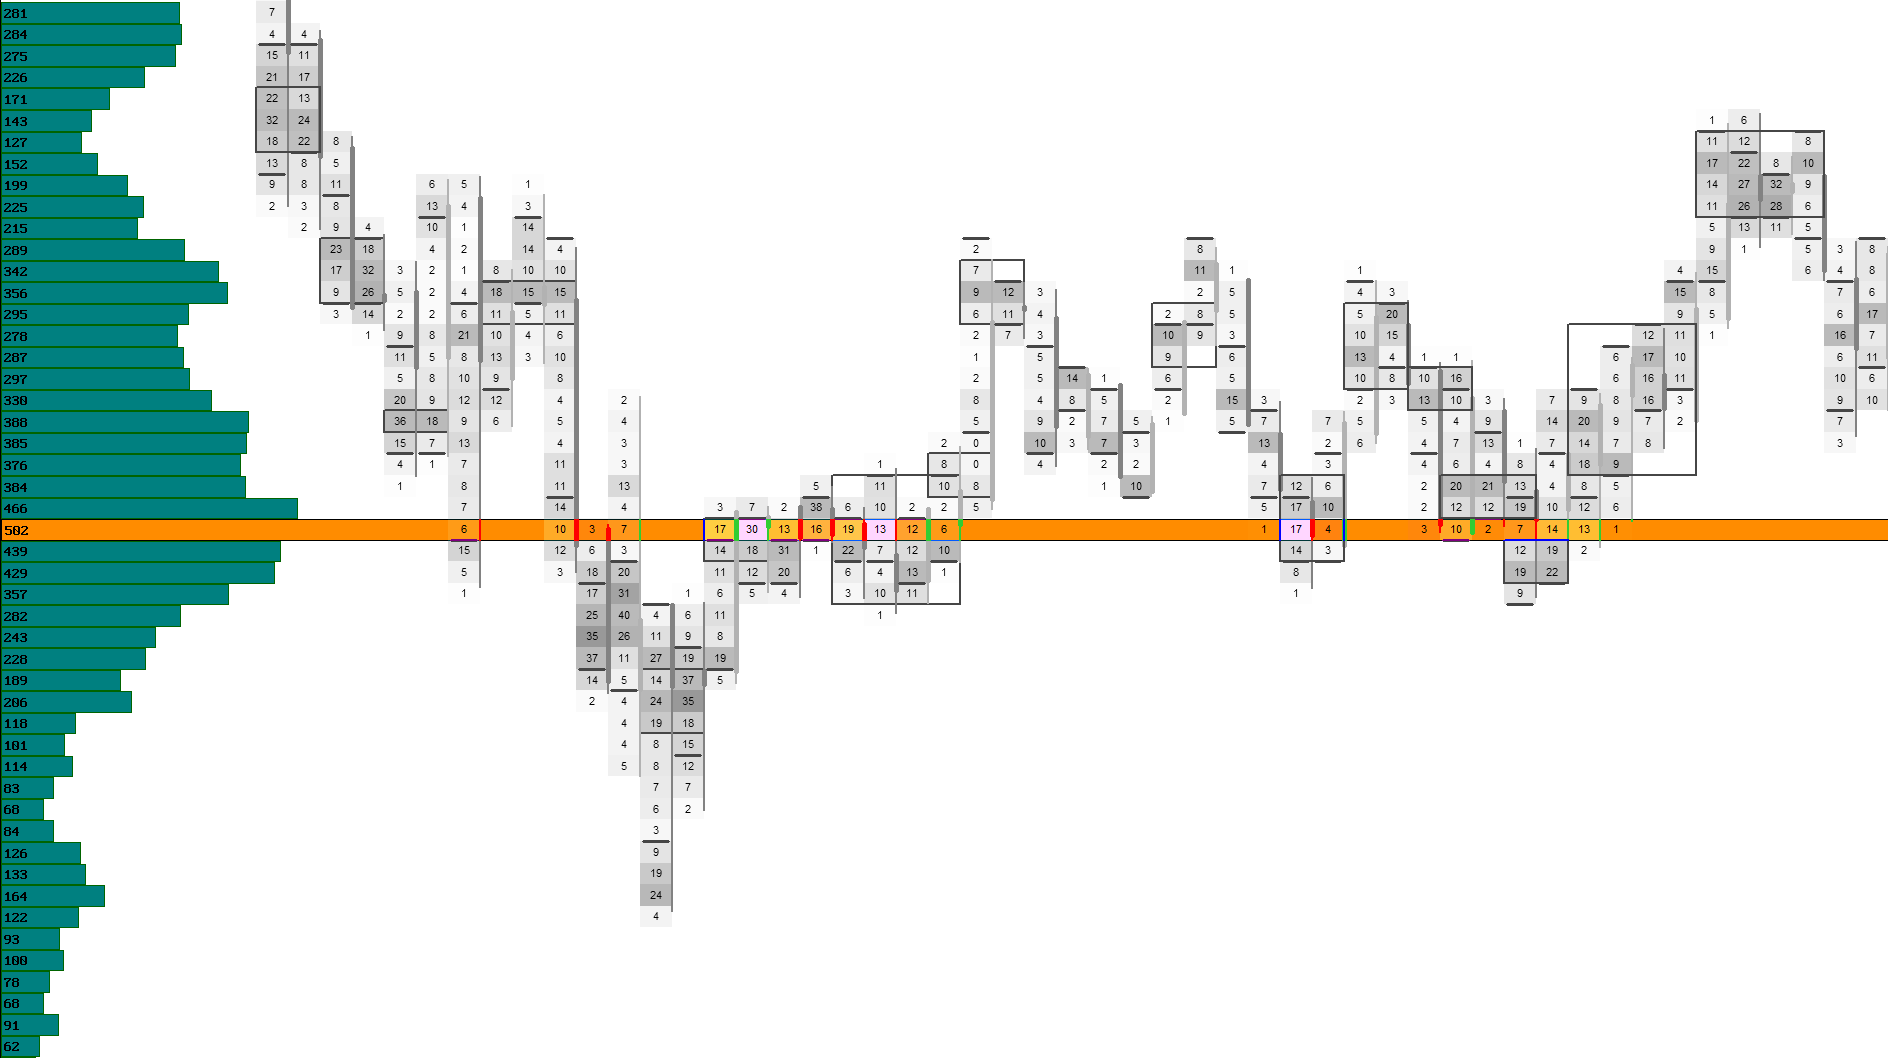
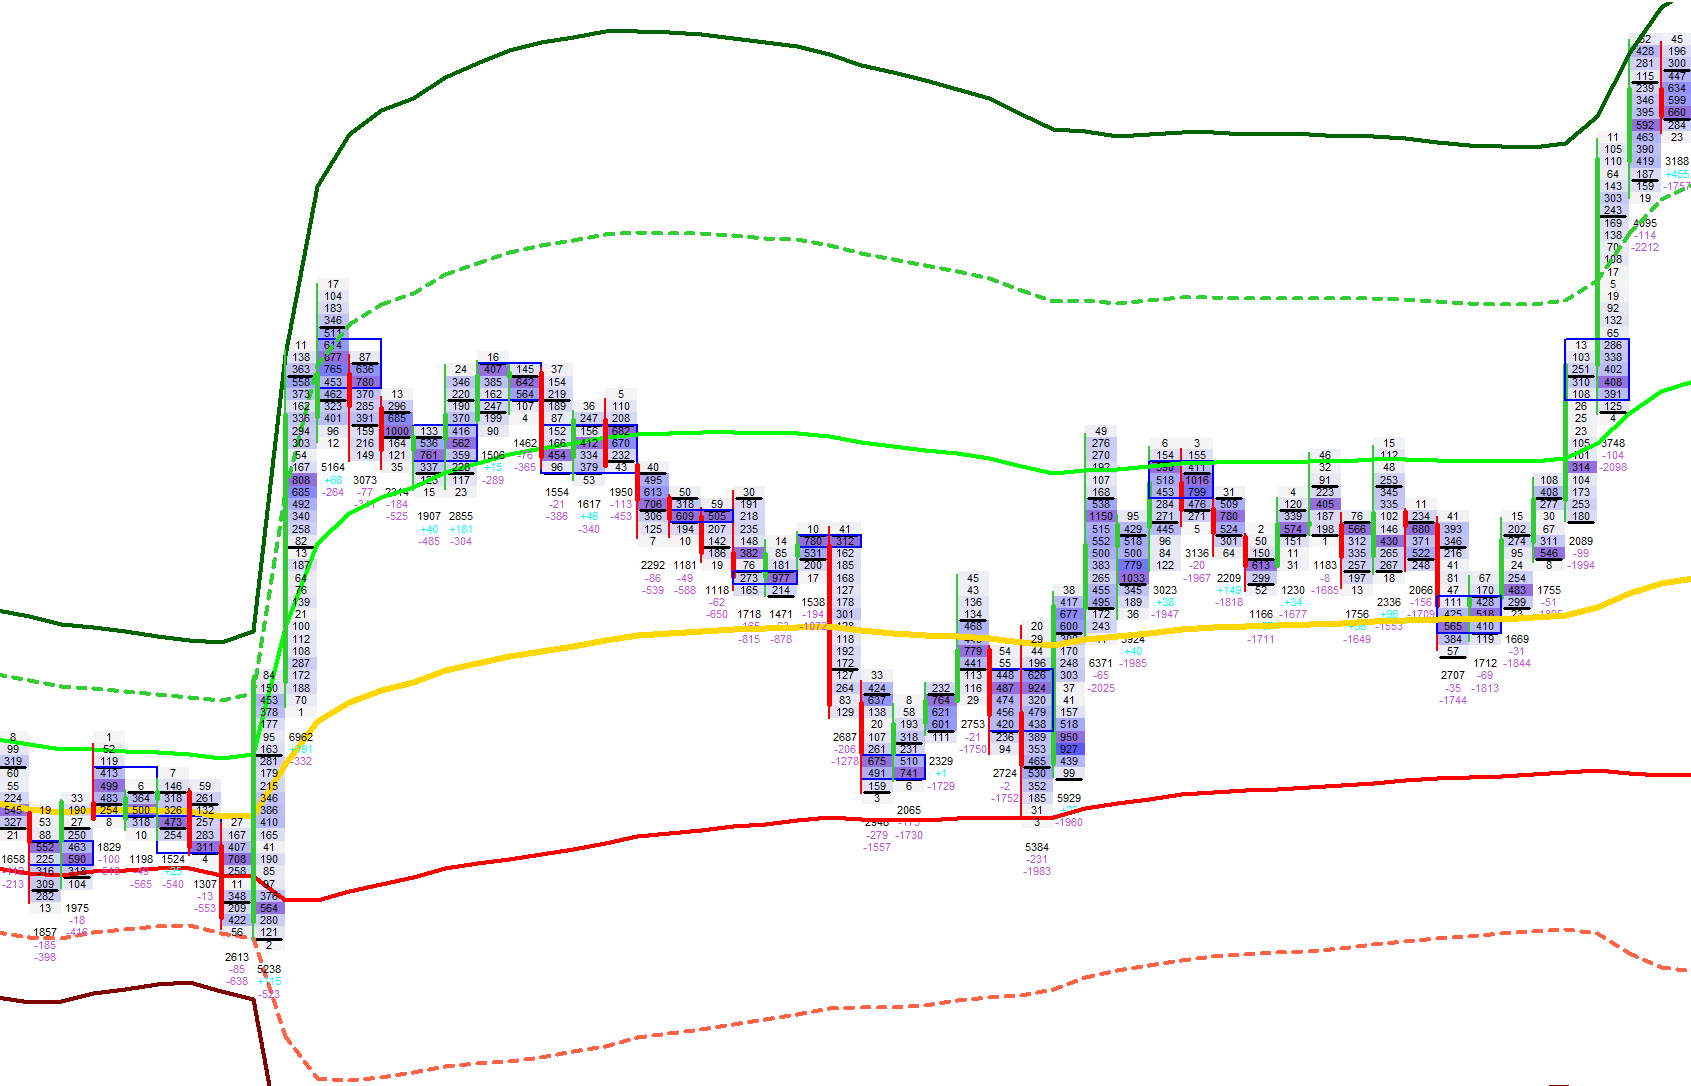
Visual Example: VWAP Standard Deviations
Interpreting VWAP
How institutions use VWAP for trend, mean‑reversion and liquidity analysis.
VWAP is widely used by institutional traders as a benchmark for execution quality and as a reference for fair value. When price trades above VWAP, it suggests buyers are in control; trading below VWAP indicates seller dominance.
Standard deviation bands add context: moves into the first band often signal healthy trend continuation, while touches of the second or third band can indicate exhaustion or areas where large players may step in to fade extremes.
Combining VWAP with the footprint gives you both the macro fair‑value structure and the microstructure detail needed to understand whether a move is supported by real orderflow.
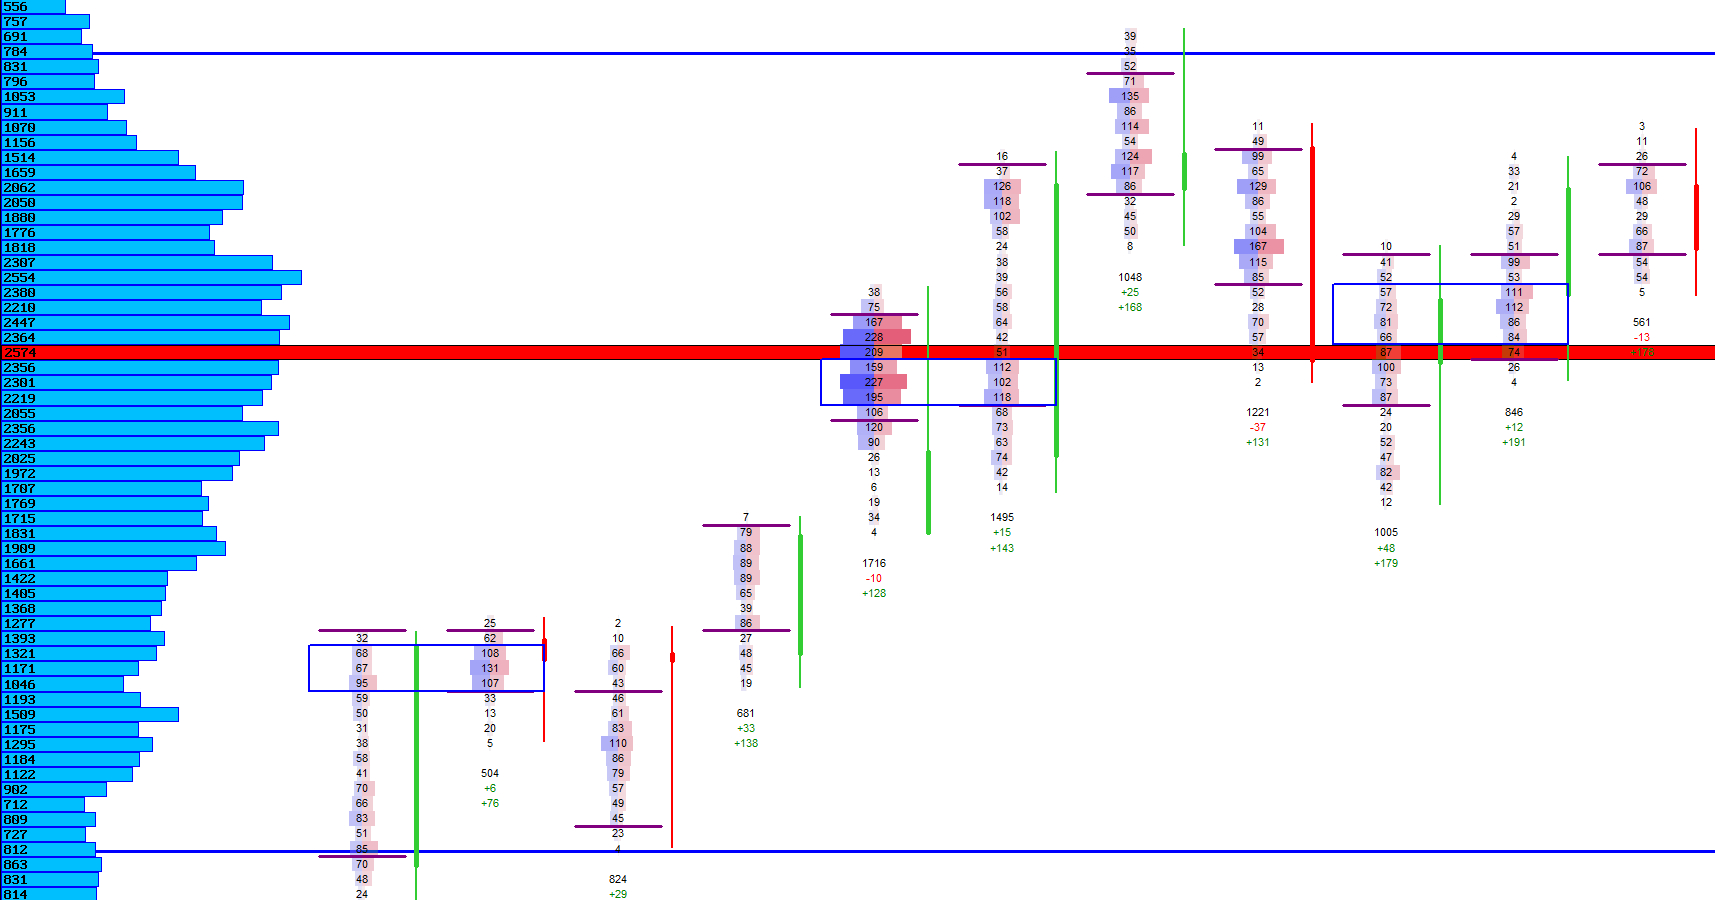
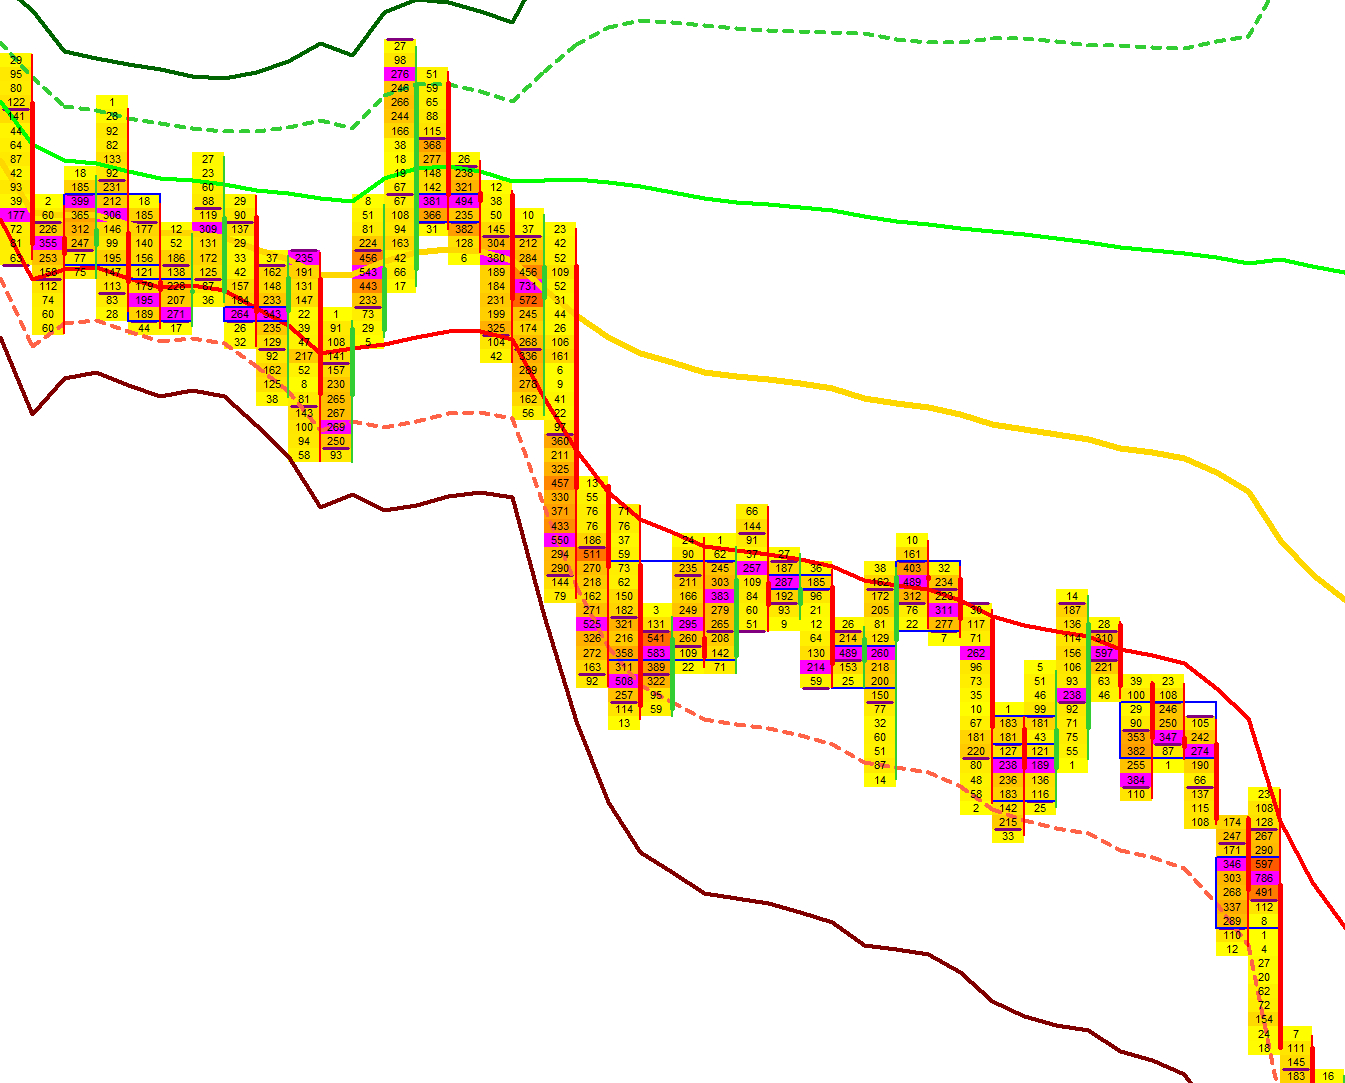
Visual Example: VWAP Interpretation
Next Chapters
Continue exploring the core modules of Footprint‑Secrets.