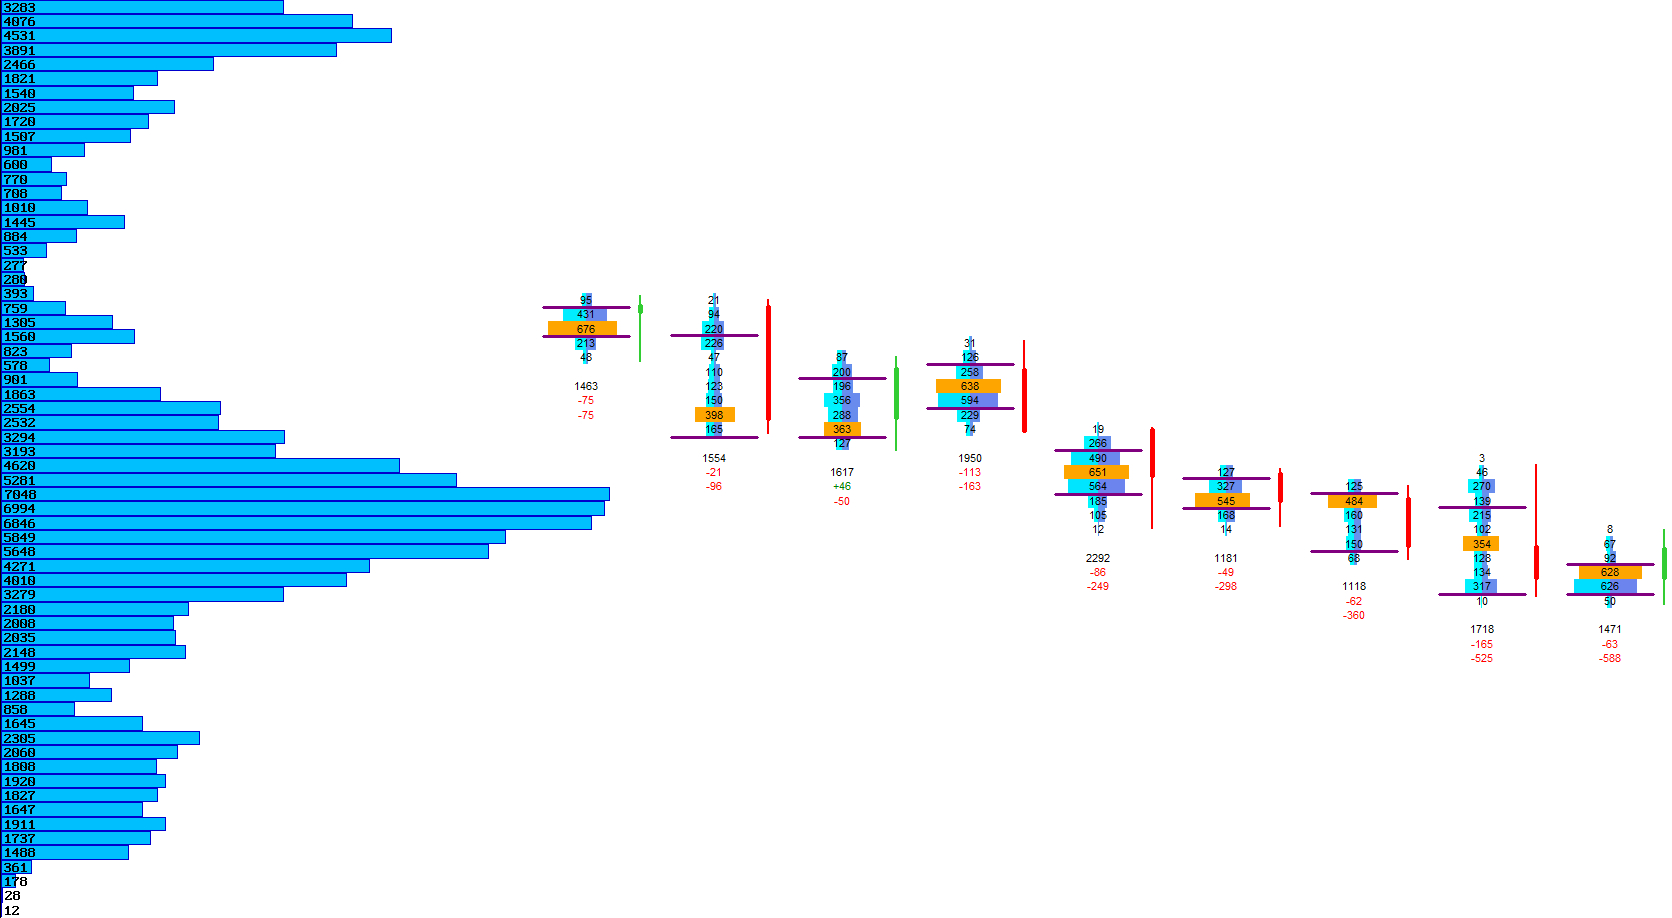
Volume Profile
A complete distribution of traded volume that reveals where the market built value and where it refused to trade.
The Volume Profile shows how much trading activity occurred at each price level across the entire session. It highlights where the market accepted price — and where participation dropped off sharply. These structural zones help identify balance areas, rejection levels, liquidity pockets and the price levels that shaped the session’s auction.
By visualizing the full distribution of traded volume, the Volume Profile provides a clear framework for understanding market context, directional conviction and the areas most likely to influence future rotations.
Profile Bars
Horizontal bars showing how much volume traded at each price level.
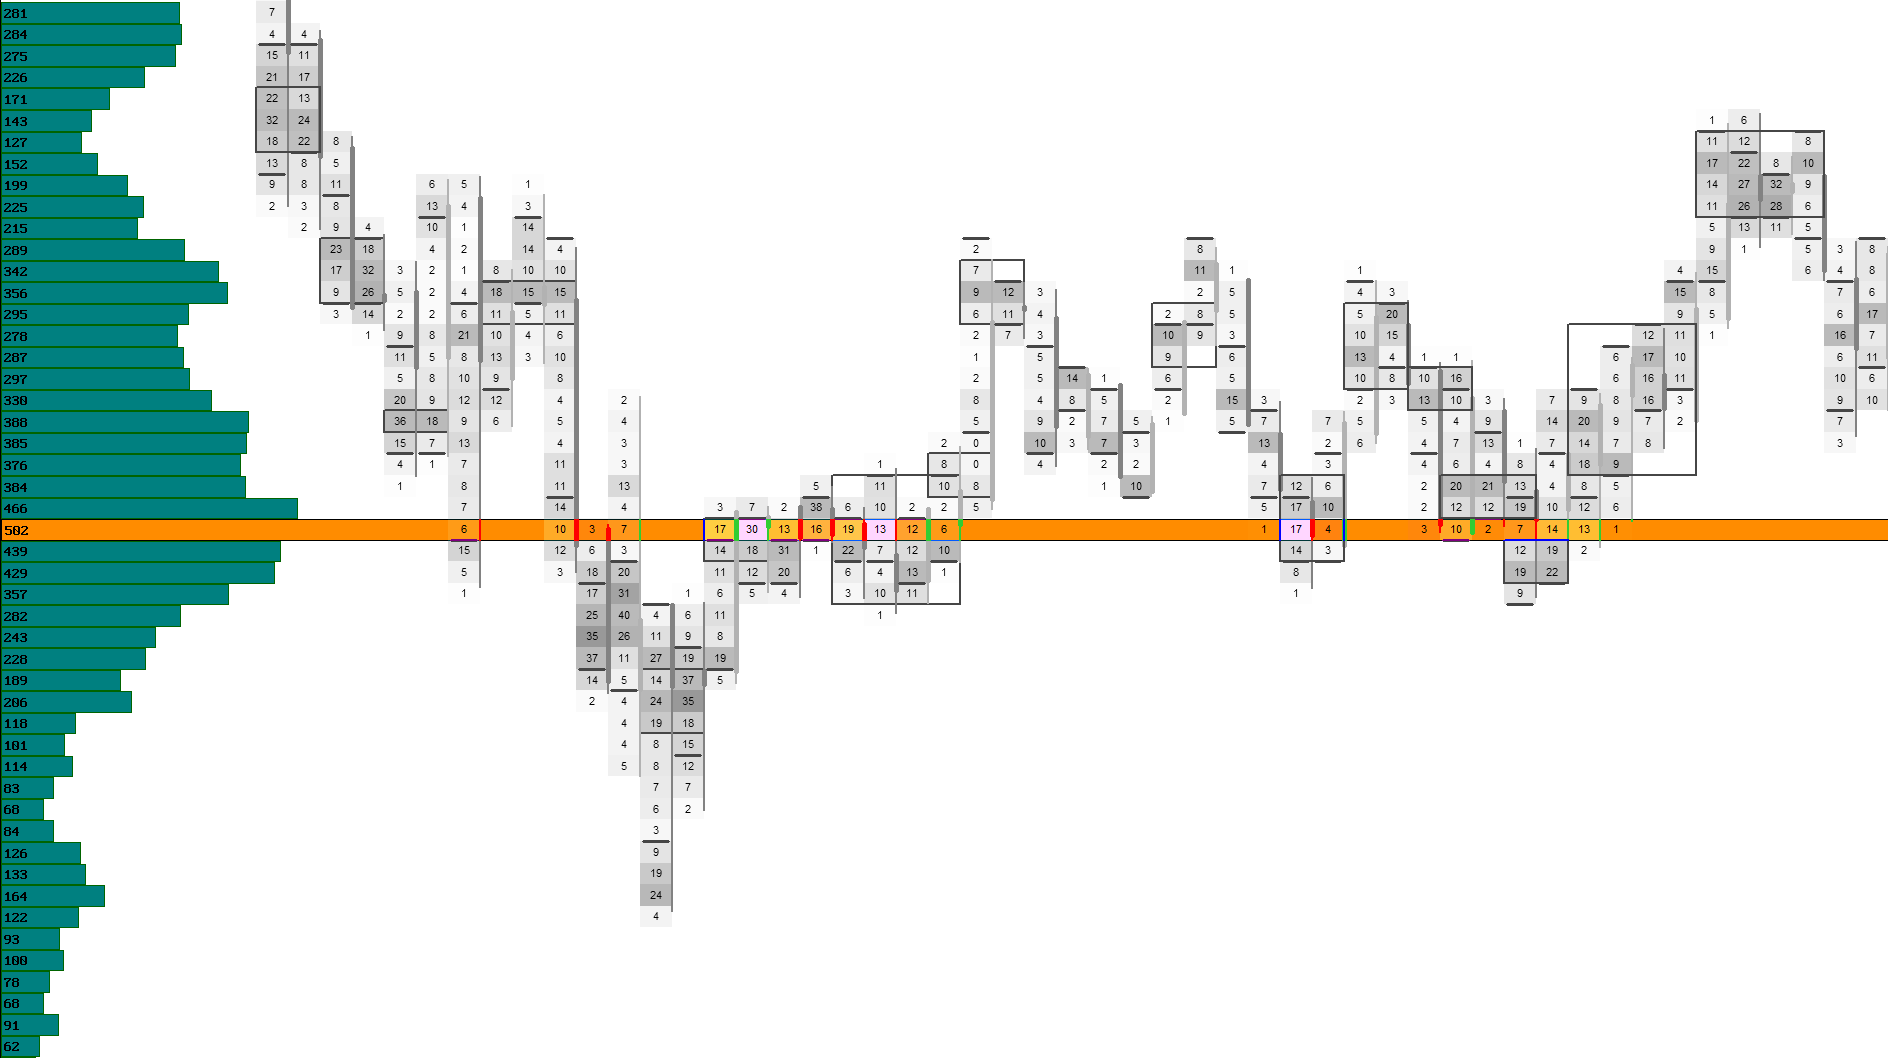
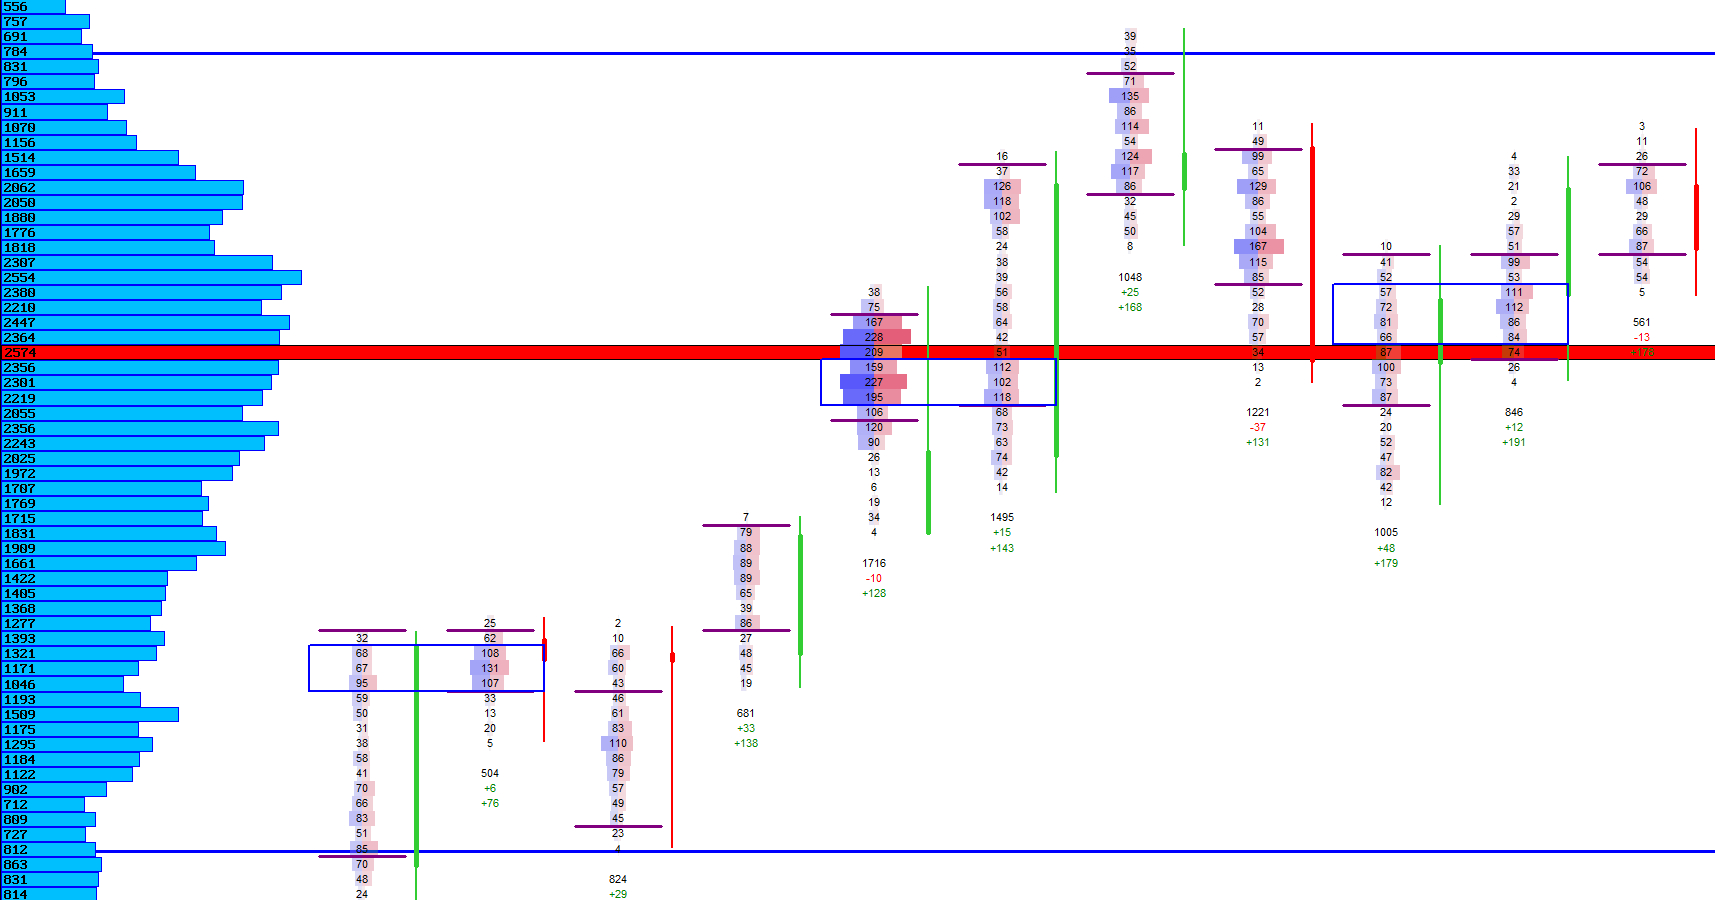
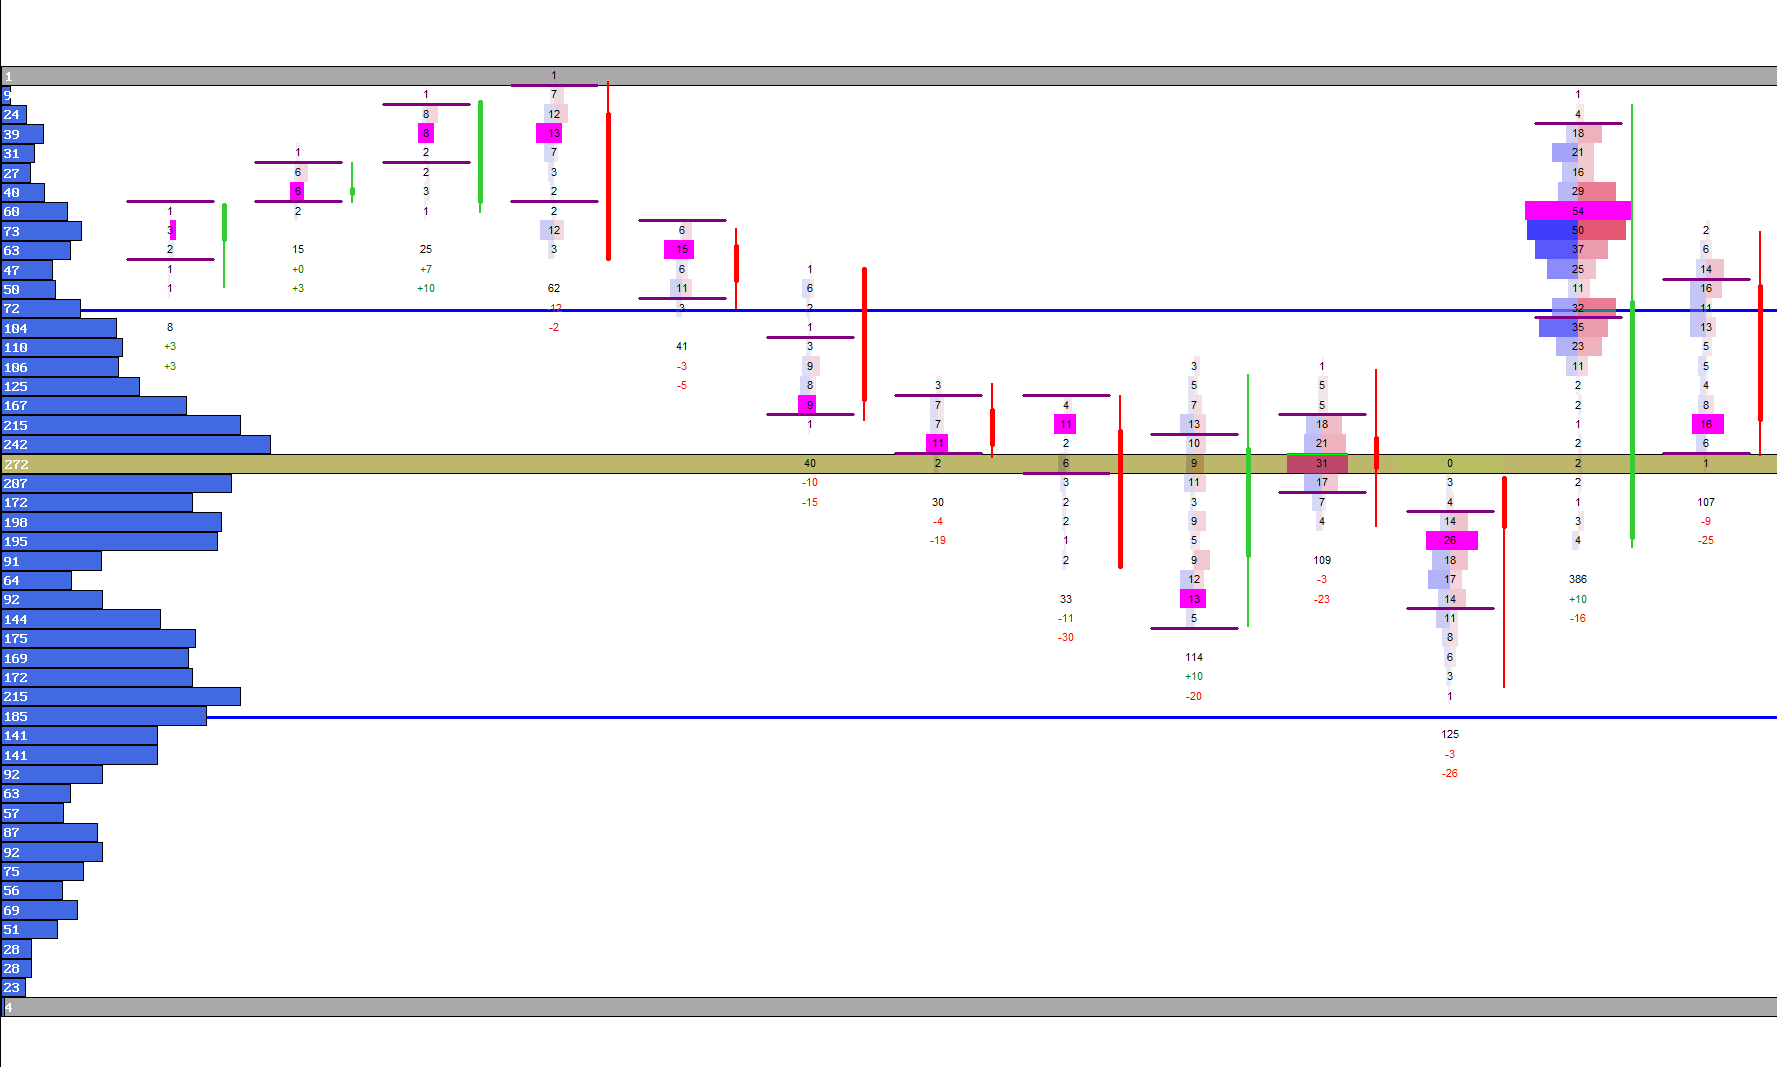
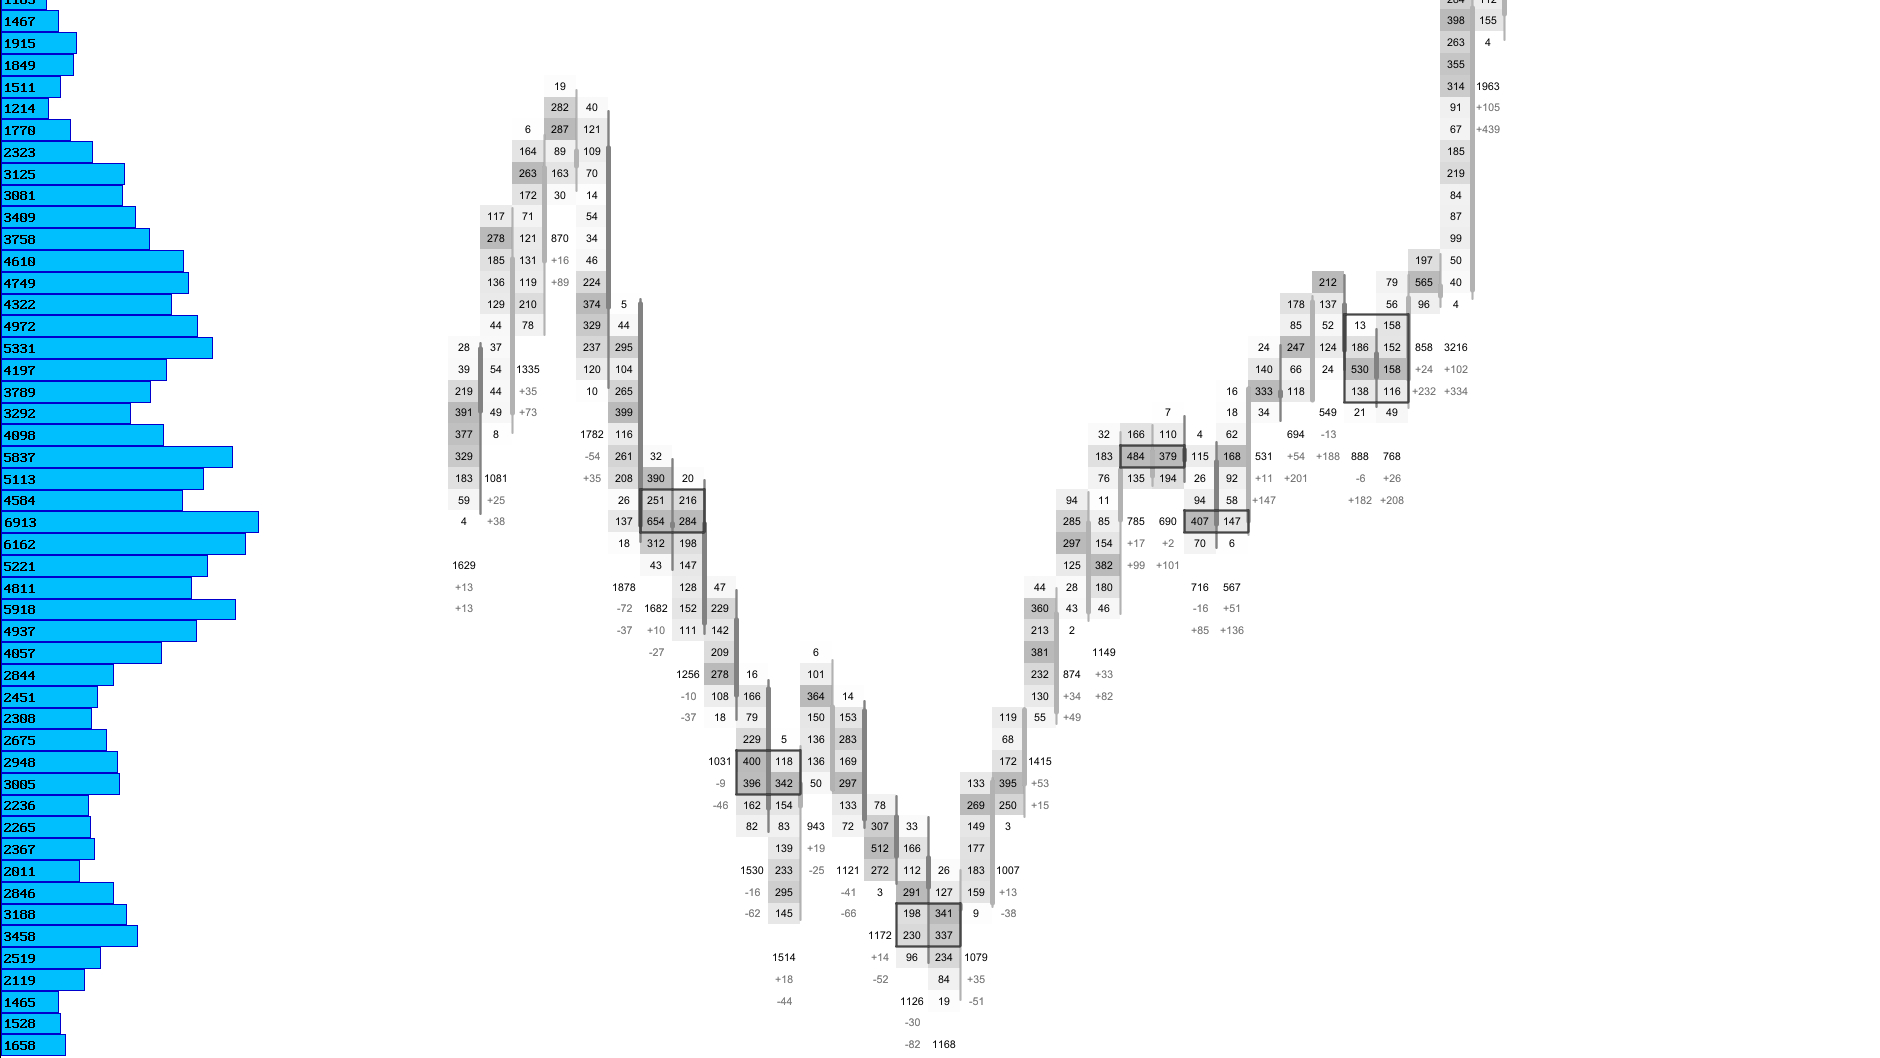
The Volume Profile displays horizontal bars that represent the total traded volume at each price level. Longer bars indicate higher participation, while shorter bars highlight areas where the market showed little interest.
Because the profile is built from real tick data, it reflects true market activity rather than synthetic averages. This makes it a powerful tool for identifying balance zones, rejection areas and price levels where liquidity concentrated.
Visual Example: Volume Profile Bars
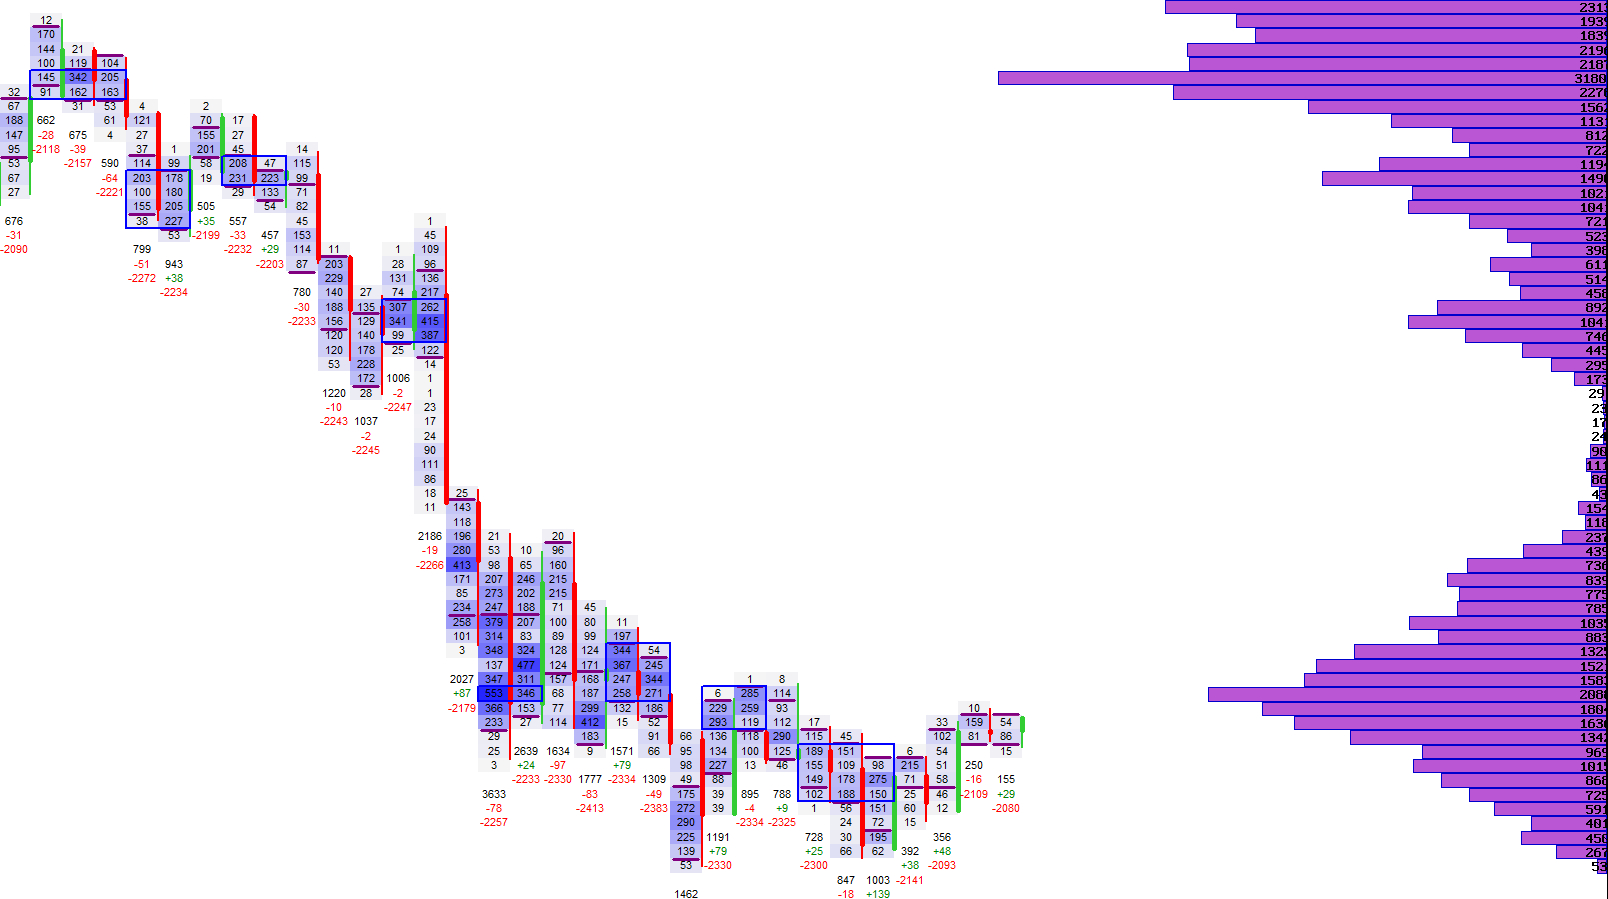
Profile Position
Choose whether the profile is drawn on the left or right side of the chart.
The Volume Profile can be placed on either side of the chart, depending on your preferred layout. Placing it on the left keeps the footprint area clean, while placing it on the right aligns it with many traditional market‑profile layouts.
The profile automatically adjusts to the visible price range and remains aligned with the footprint’s price axis, ensuring a clean and consistent visual structure.
Profile Position Modes
| Mode | Description |
|---|---|
| Left‑Side Profile | Draws the profile on the left side of the chart for a footprint‑focused layout. |
| Right‑Side Profile | Places the profile on the right side, similar to traditional market‑profile charts. |
Visual Example: Profile Position
Profile Width
Control how wide the profile extends into the chart area.
The width of the Volume Profile determines how far the bars extend into the chart. A narrow profile keeps the footprint area spacious, while a wider profile emphasizes the volume distribution more prominently.
The width is defined as a percentage of the total chart area, allowing you to fine‑tune the balance between footprint detail and structural volume information.
Profile Width Modes
| Mode | Description |
|---|---|
| Narrow Profile | Minimal intrusion into the footprint area for maximum candle clarity. |
| Medium Profile | A balanced width that highlights structure without overwhelming the chart. |
| Wide Profile | Emphasizes volume distribution for structure‑focused analysis. |
Next Chapters
Continue exploring the core modules of Footprint‑Secrets.