Low Volume Nodes (LVN)
Identify rejection zones and low‑interest prices inside the session.
Low Volume Nodes highlight price levels where the market showed little interest. These areas often act as rejection zones — levels where price moved quickly through without building acceptance. LVNs help you identify inefficiencies, gaps in participation and potential turning points.
By revealing where the auction lacked engagement, LVNs provide a structural layer that complements the value area, POC and volume profile — giving you a clearer picture of where the market accepted or rejected price during the session.
LVN Detection
Automatically identifies low‑interest price levels inside the session’s volume distribution.
LVNs are detected by analyzing the session’s volume distribution and identifying price levels where traded volume is significantly lower than surrounding prices. These areas represent inefficiencies in the auction — zones where the market moved quickly and did not build acceptance.
The detection algorithm focuses on the region around the POC and expands outward within a configurable search range, ensuring that LVNs are structurally relevant to the session.
LVN Modes
| Mode | Description |
|---|---|
| Low‑Interest Levels | Highlights price levels where traded volume is significantly below surrounding activity. |
| Rejection Zones | Marks areas where price moved quickly through without building acceptance. |
| Structural LVNs | Focuses on LVNs near the POC and expands outward for session‑relevant structure. |
| Minimalist LVN Lines | Draws thin, unobtrusive LVN markers for clean chart layouts. |
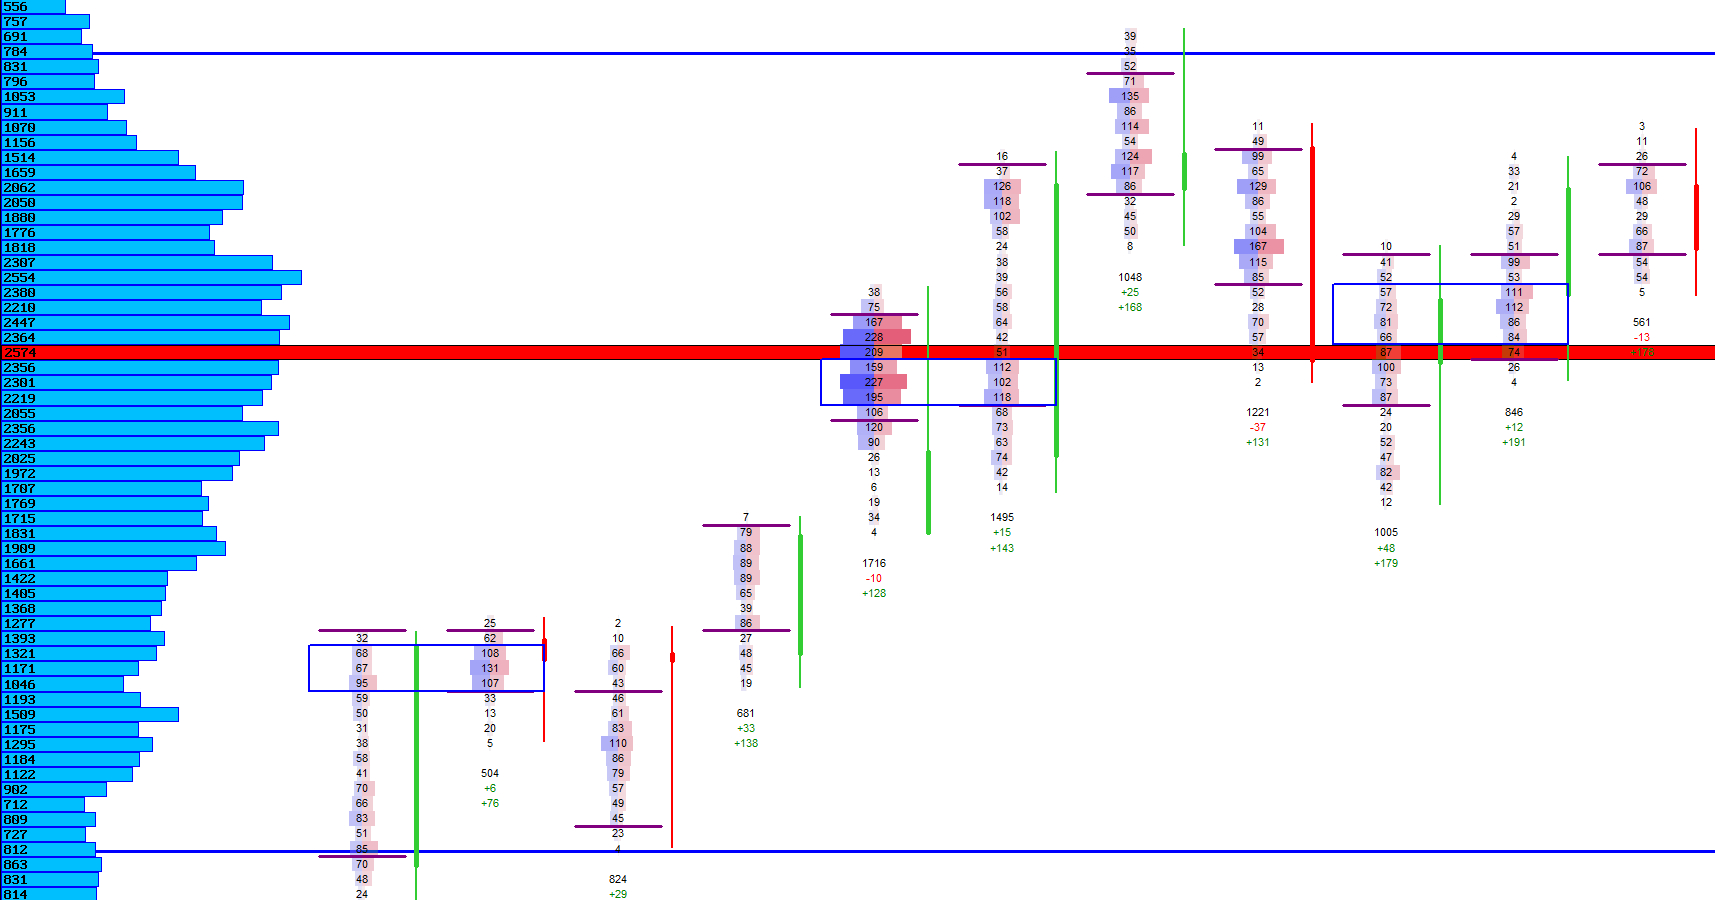
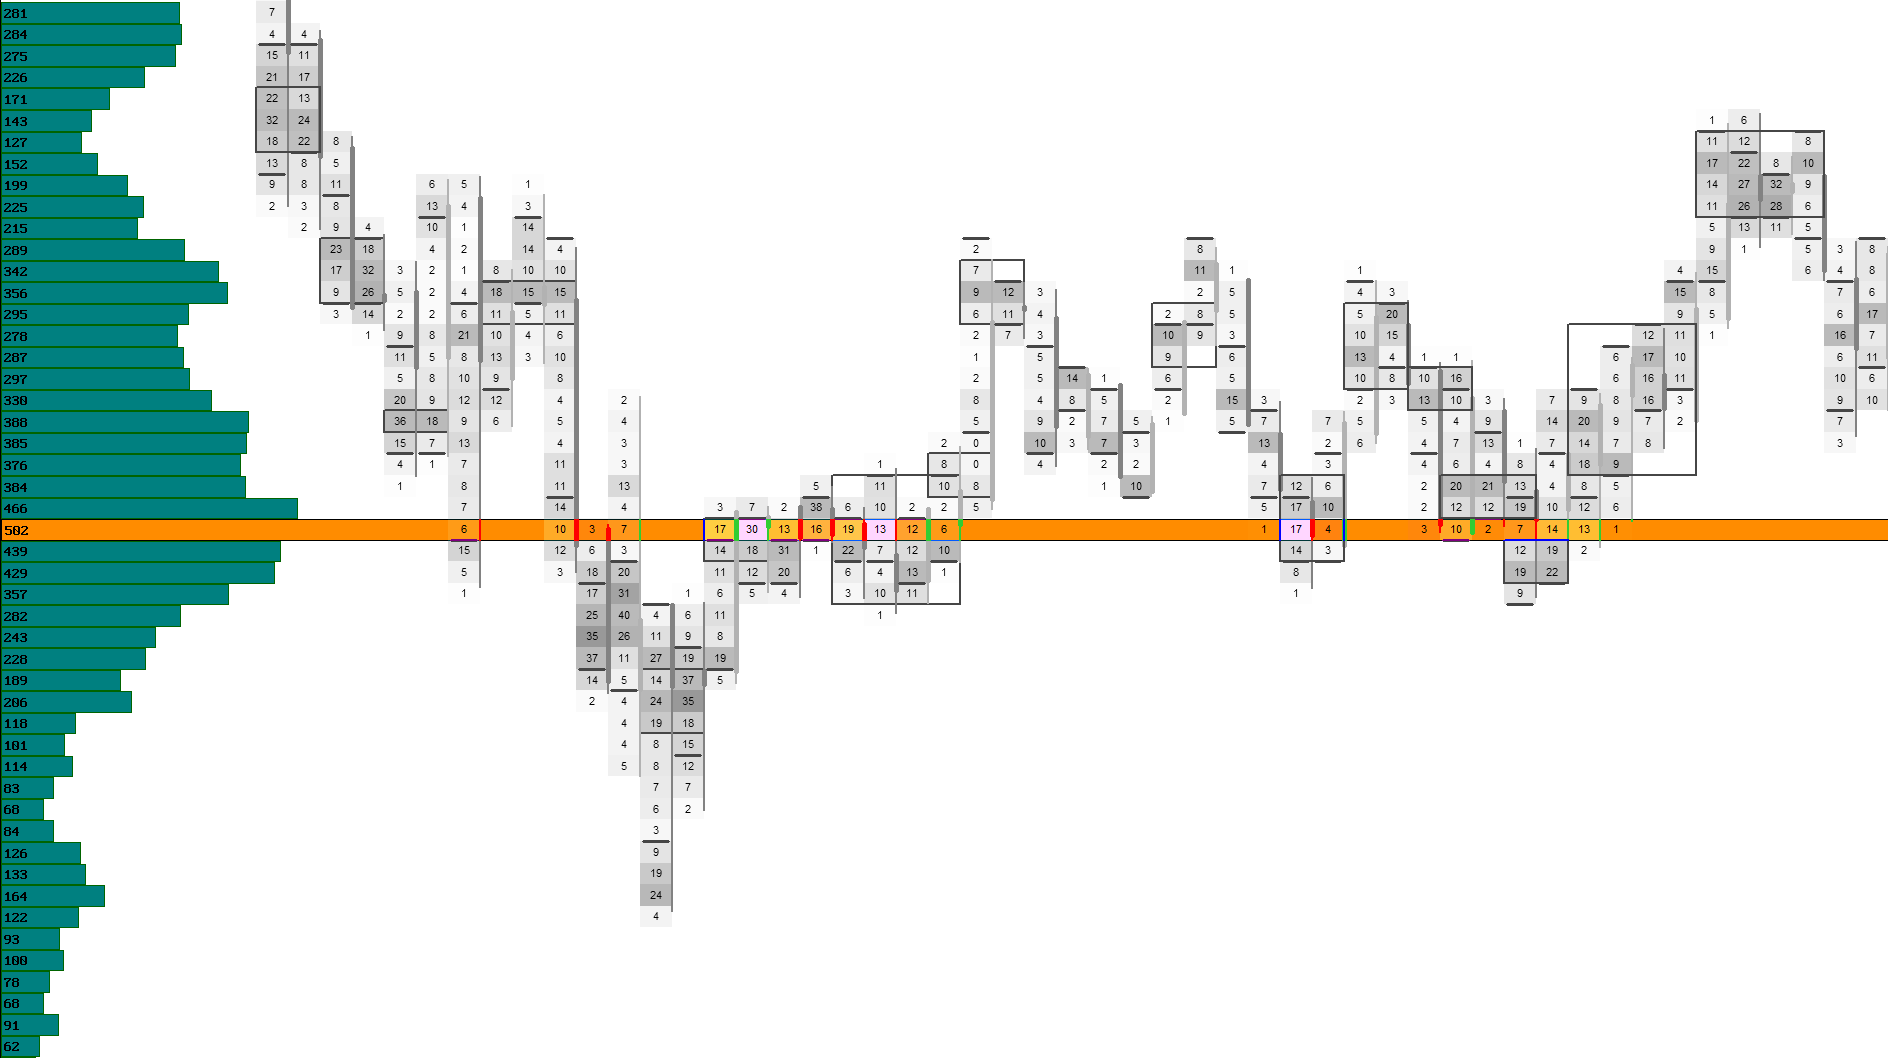
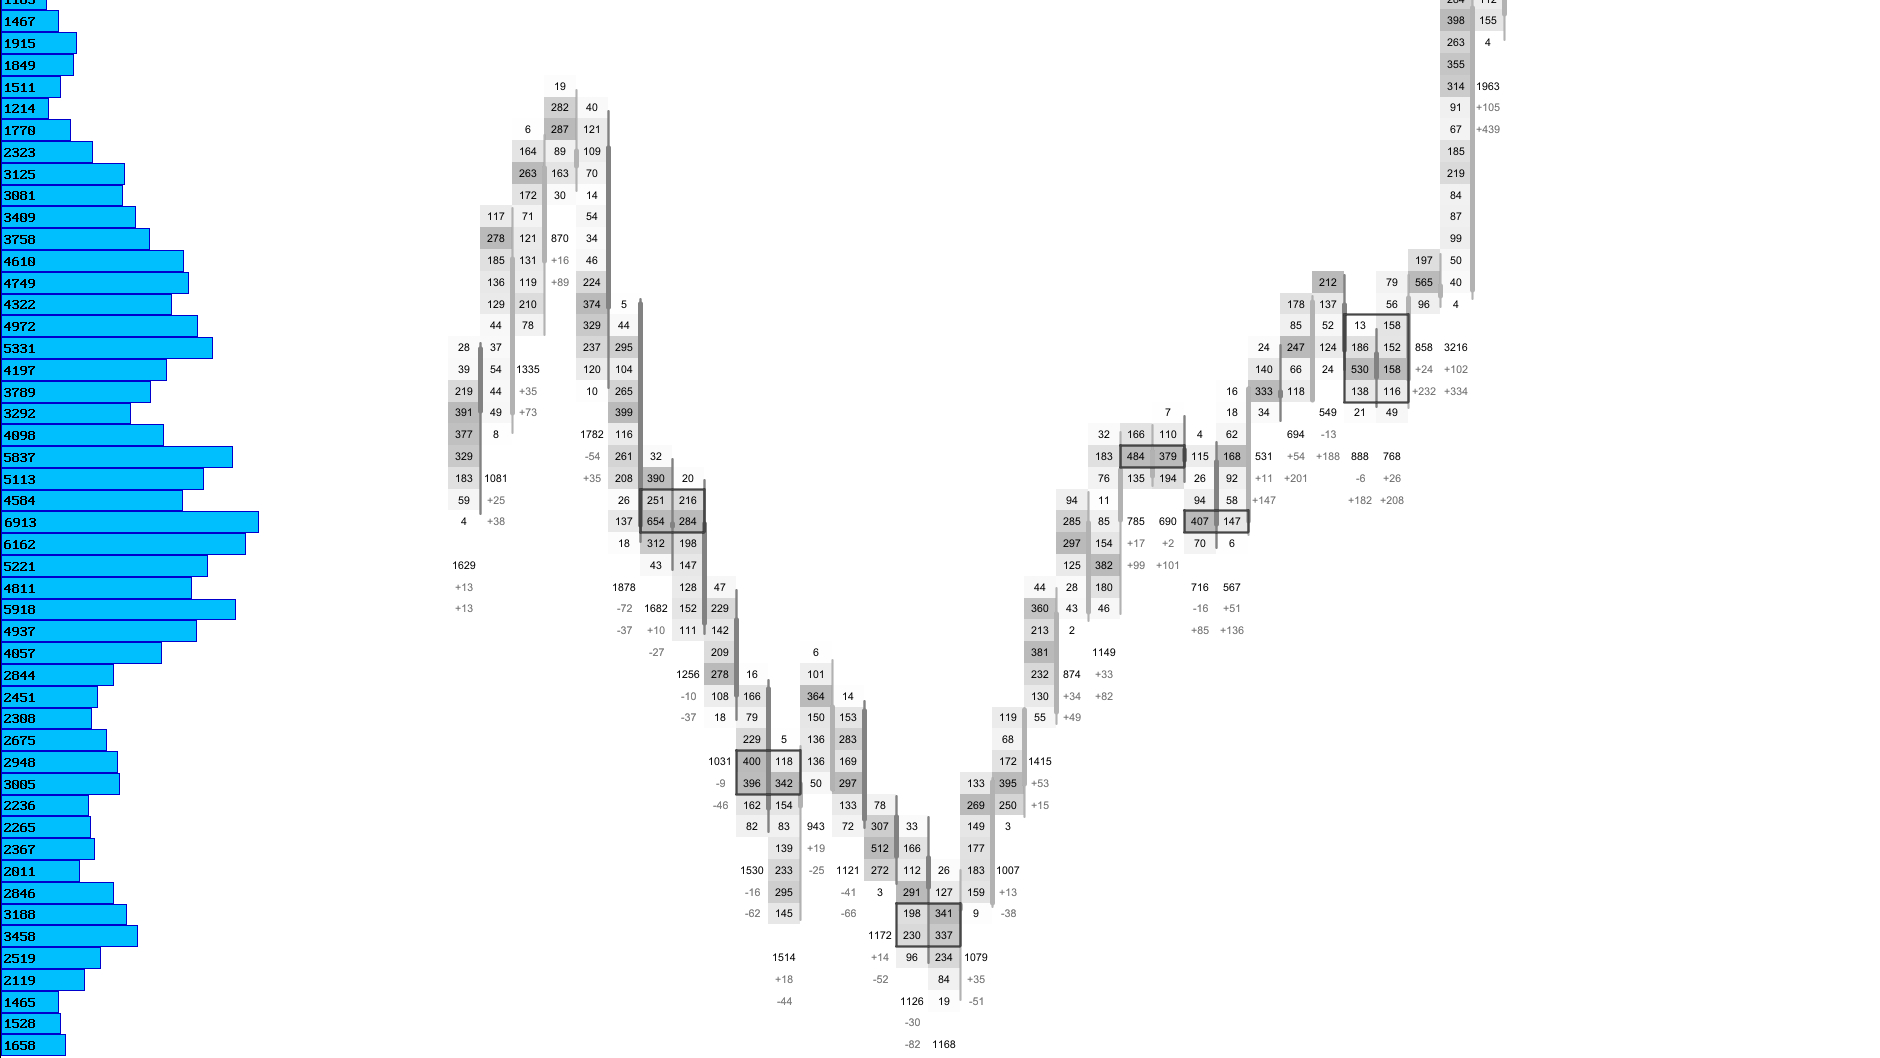
Visual Example: LVN Detection
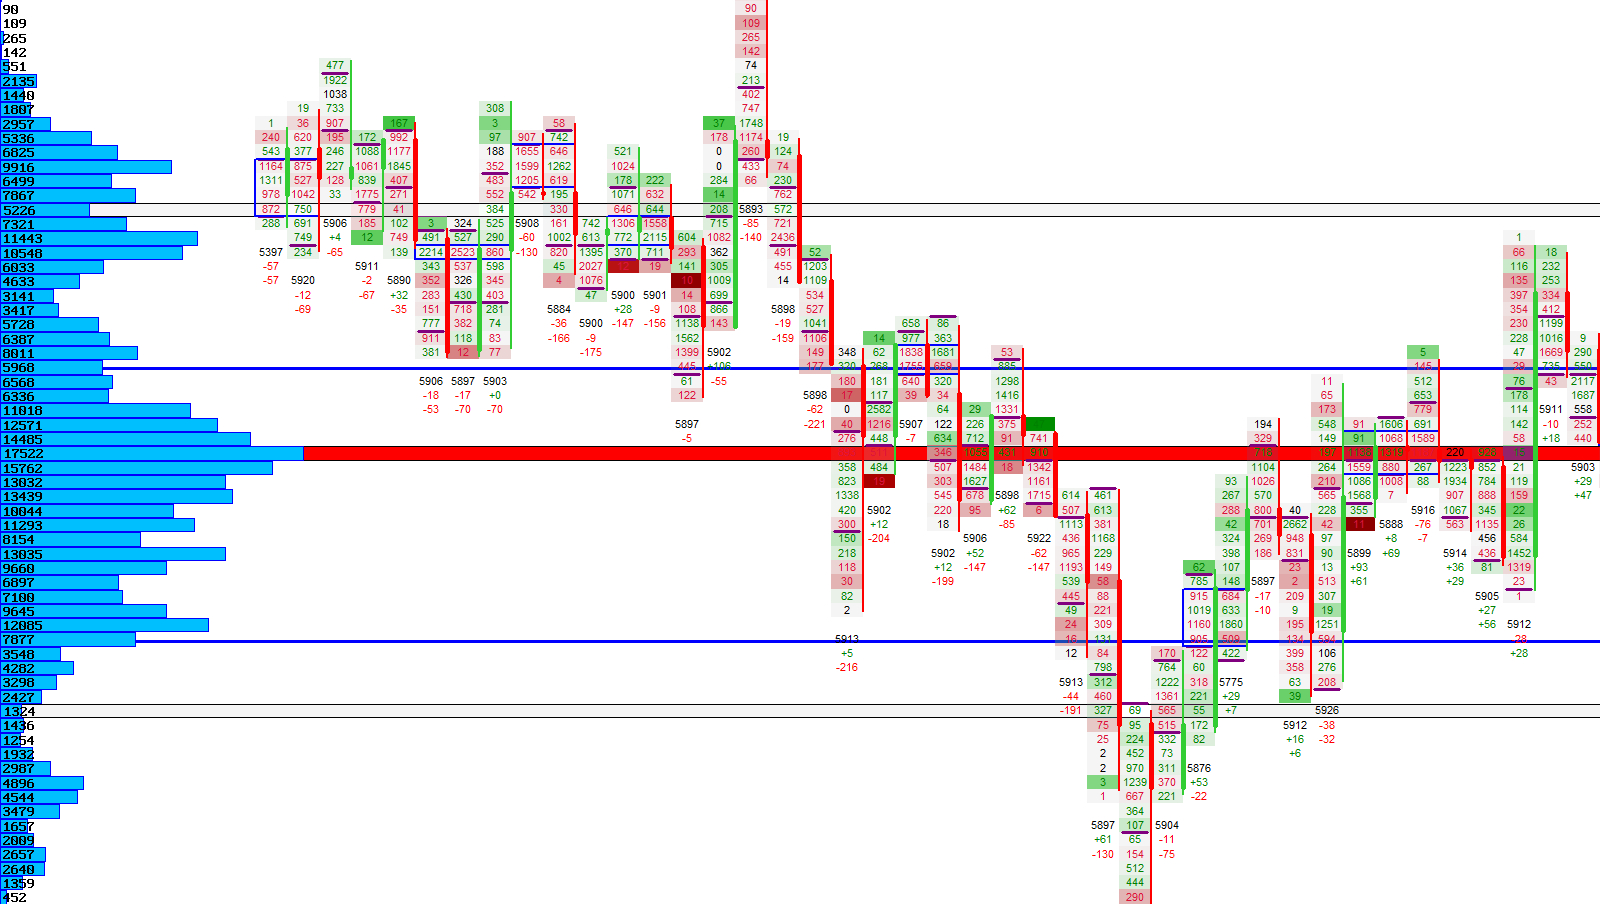
LVN Lines
Highlights LVN levels directly on the chart for quick visual recognition.
Once detected, LVNs are drawn as horizontal highlights across the chart. These lines mark price levels where the market showed little interest and often act as rejection zones.
LVN lines remain aligned with the footprint’s price axis and adapt to the visible chart range, ensuring a clean and consistent visual structure.
LVN Line Modes
| Mode | Description |
|---|---|
| Standard LVN Lines | Draws clear horizontal markers at low‑volume price levels. |
| Highlighted LVNs | Uses subtle background shading to emphasize rejection zones. |
| Border‑Only Mode | Draws LVNs using only a thin border for minimal visual impact. |
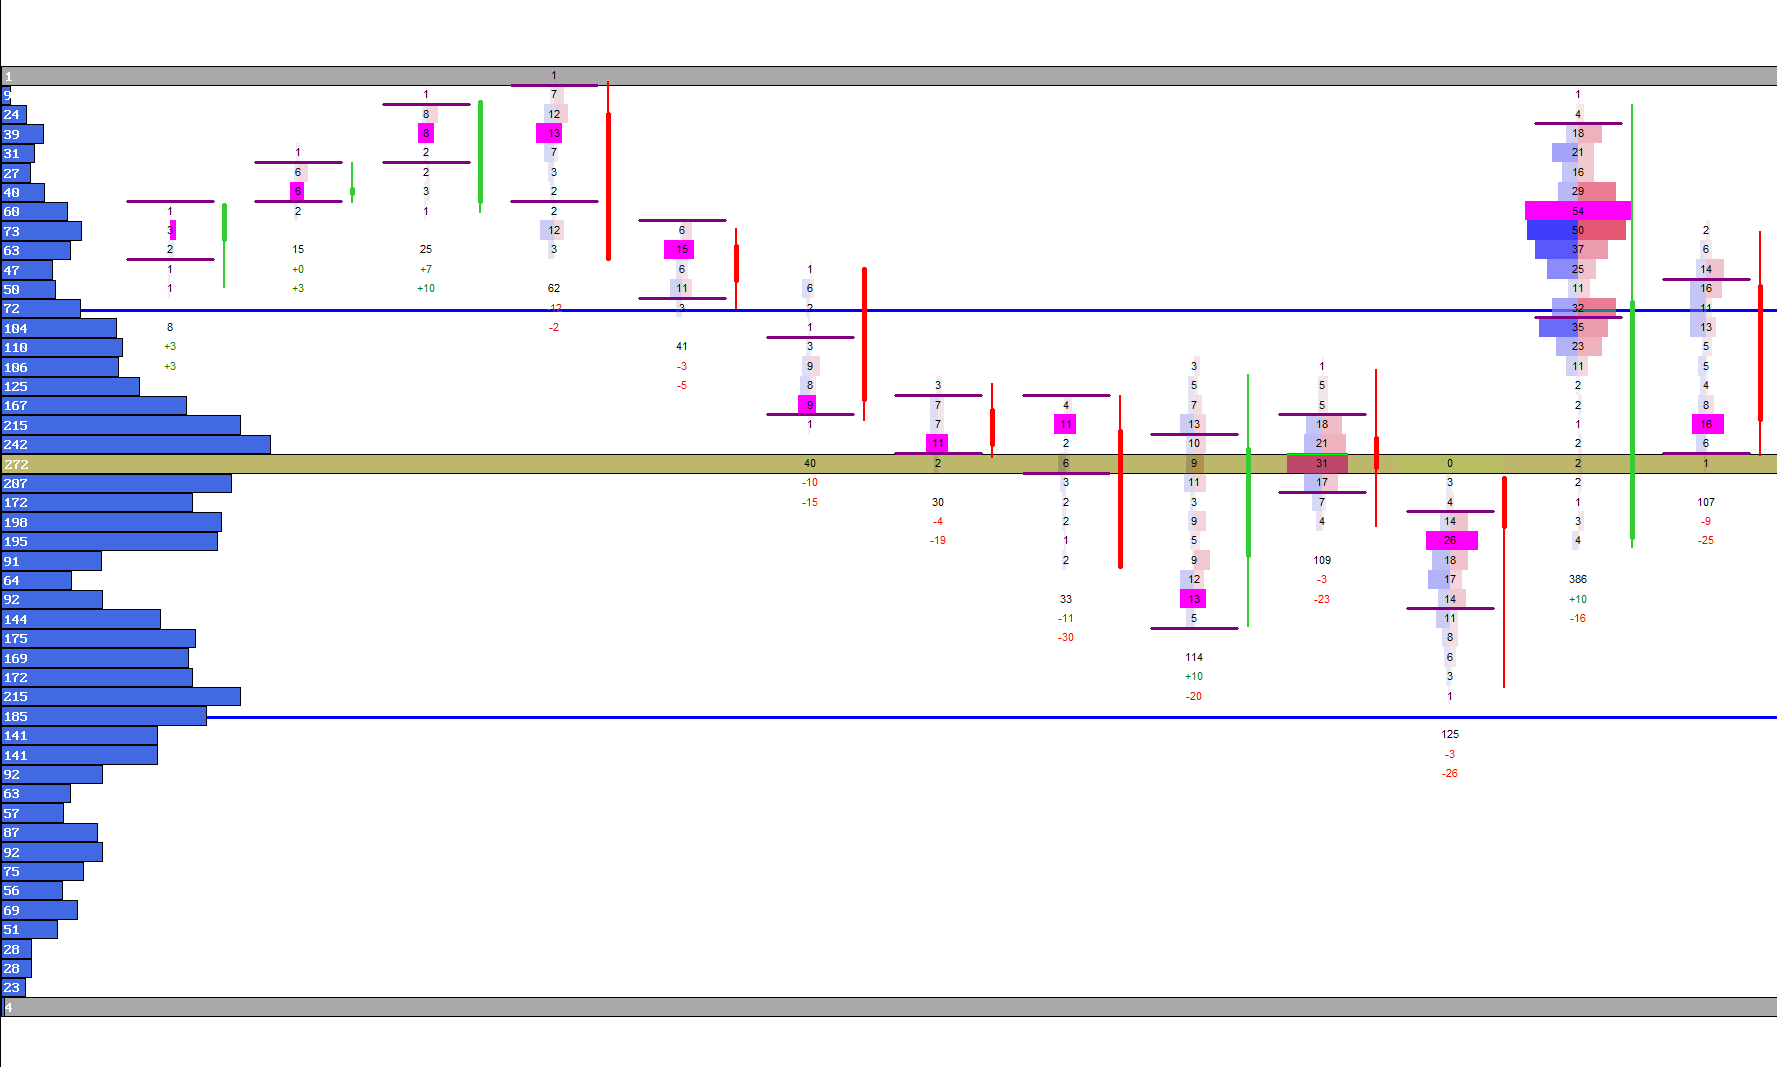
Visual Example: LVN Lines
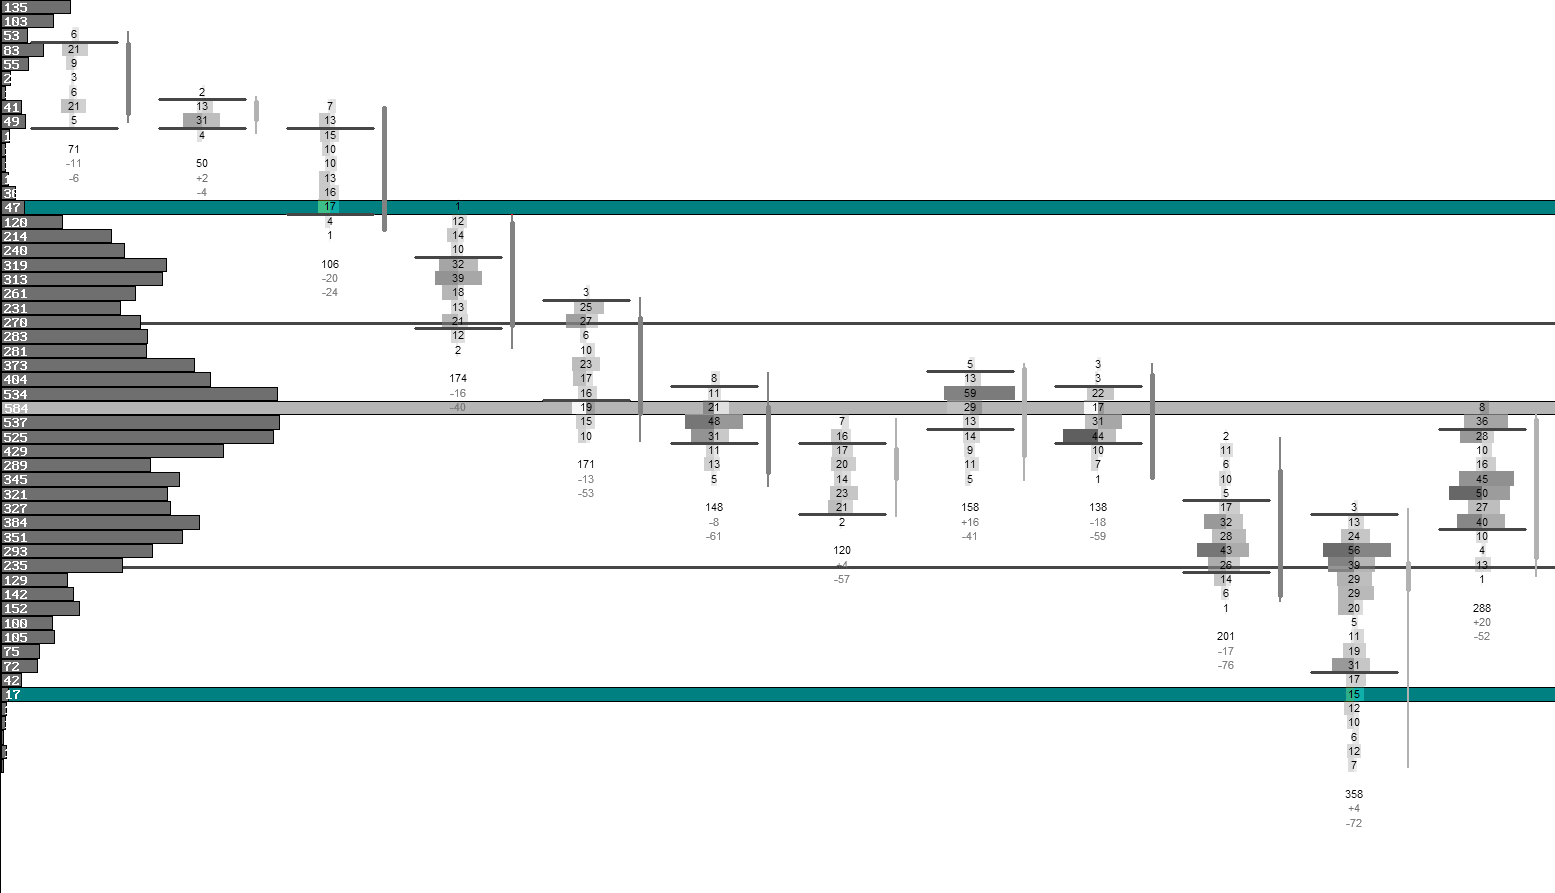
Interpreting LVNs
Understand how LVNs reveal rejection, imbalance and market intent.
LVNs often act as rejection zones — areas where price moved quickly through and may do so again. When price approaches an LVN, it frequently accelerates, as there is little historical interest or liquidity at that level.
LVNs can also mark transitions between balance areas. When price breaks through an LVN and begins building volume above or below it, the market may be shifting to a new fair‑value region.
Combining LVNs with the Volume Profile and POC gives you a complete picture of where the market accepted or rejected value during the session.
Next Chapters
Continue exploring the core modules of Footprint‑Secrets.