Point of Control (POC)
The most traded price level of the session — where buyers and sellers interacted the most.
The Point of Control marks the price level with the highest traded volume of the entire session. It represents the market’s strongest area of agreement — the level where buyers and sellers interacted most intensely. As a structural anchor, the POC often acts as a magnet during balance and a pivot during directional moves.
Because it reflects where the majority of liquidity was exchanged, the POC provides essential context for understanding market balance, directional conviction and the price levels most likely to influence future rotations.
POC Line
A clear visual highlight marking the session’s most traded price.
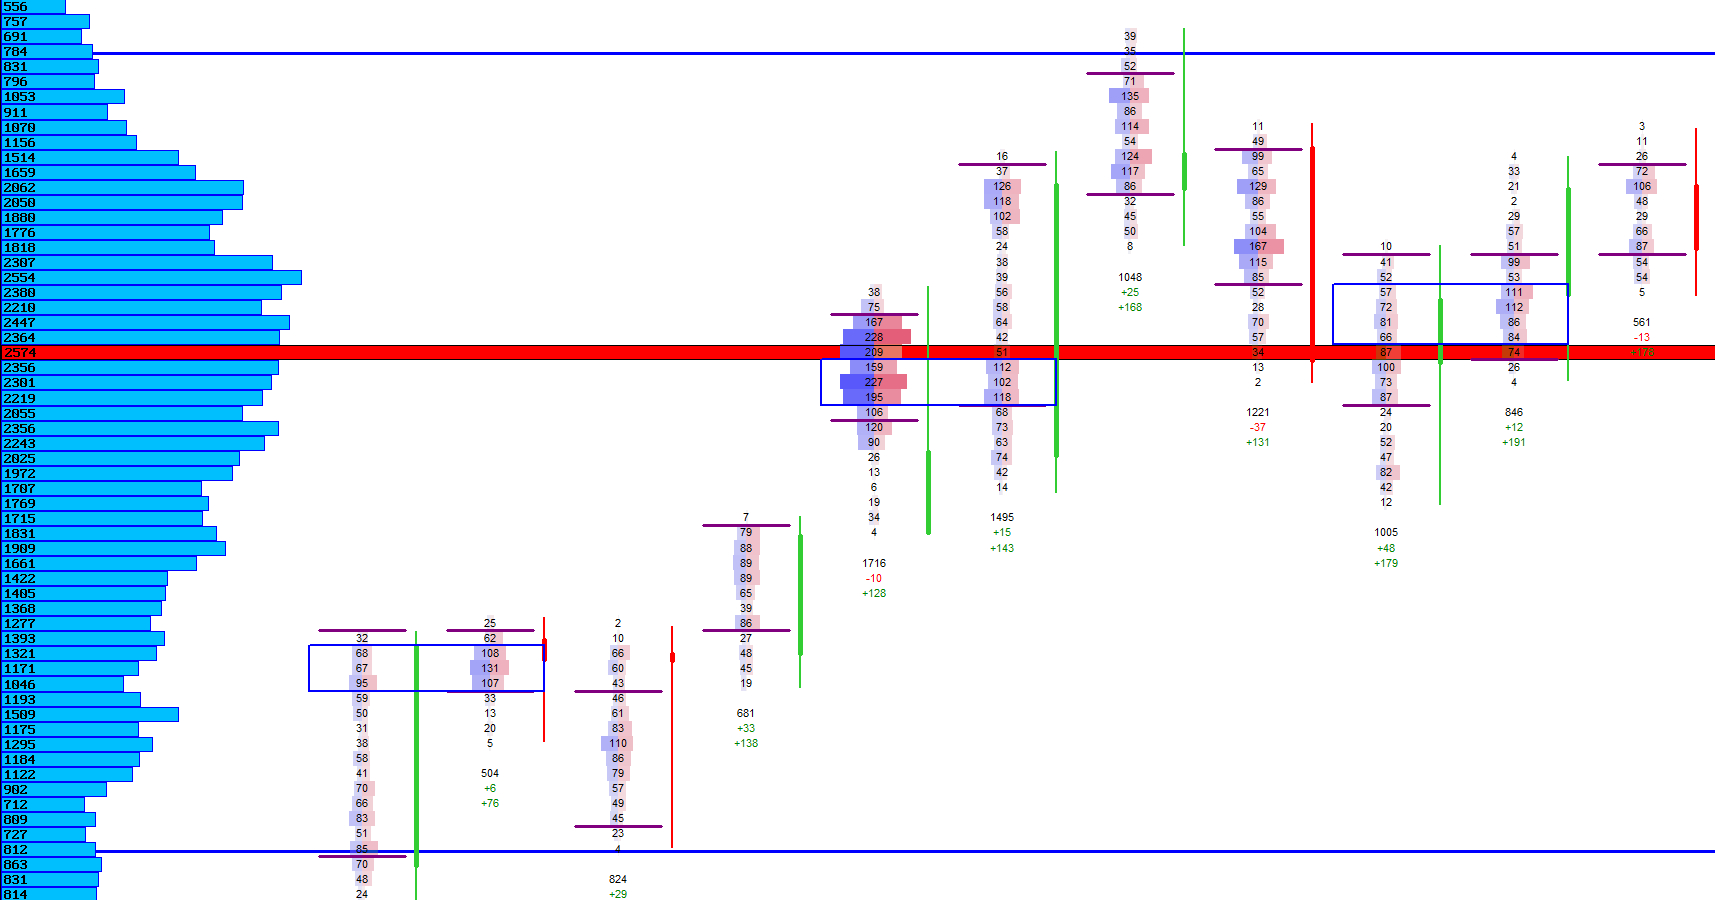
The POC is drawn as a horizontal highlight across the chart at the price level where the highest volume accumulated. This makes it easy to identify the session’s fair‑value center at a glance. Because the POC is based on real traded volume, it reflects genuine market interest rather than synthetic averages.
The POC highlight automatically adapts to the visible price range and remains aligned with the footprint’s price axis, ensuring a clean and consistent visual structure.
POC Modes
| Mode | Description |
|---|---|
| Standard POC Line | Draws a clear horizontal highlight at the strongest price level of the session. |
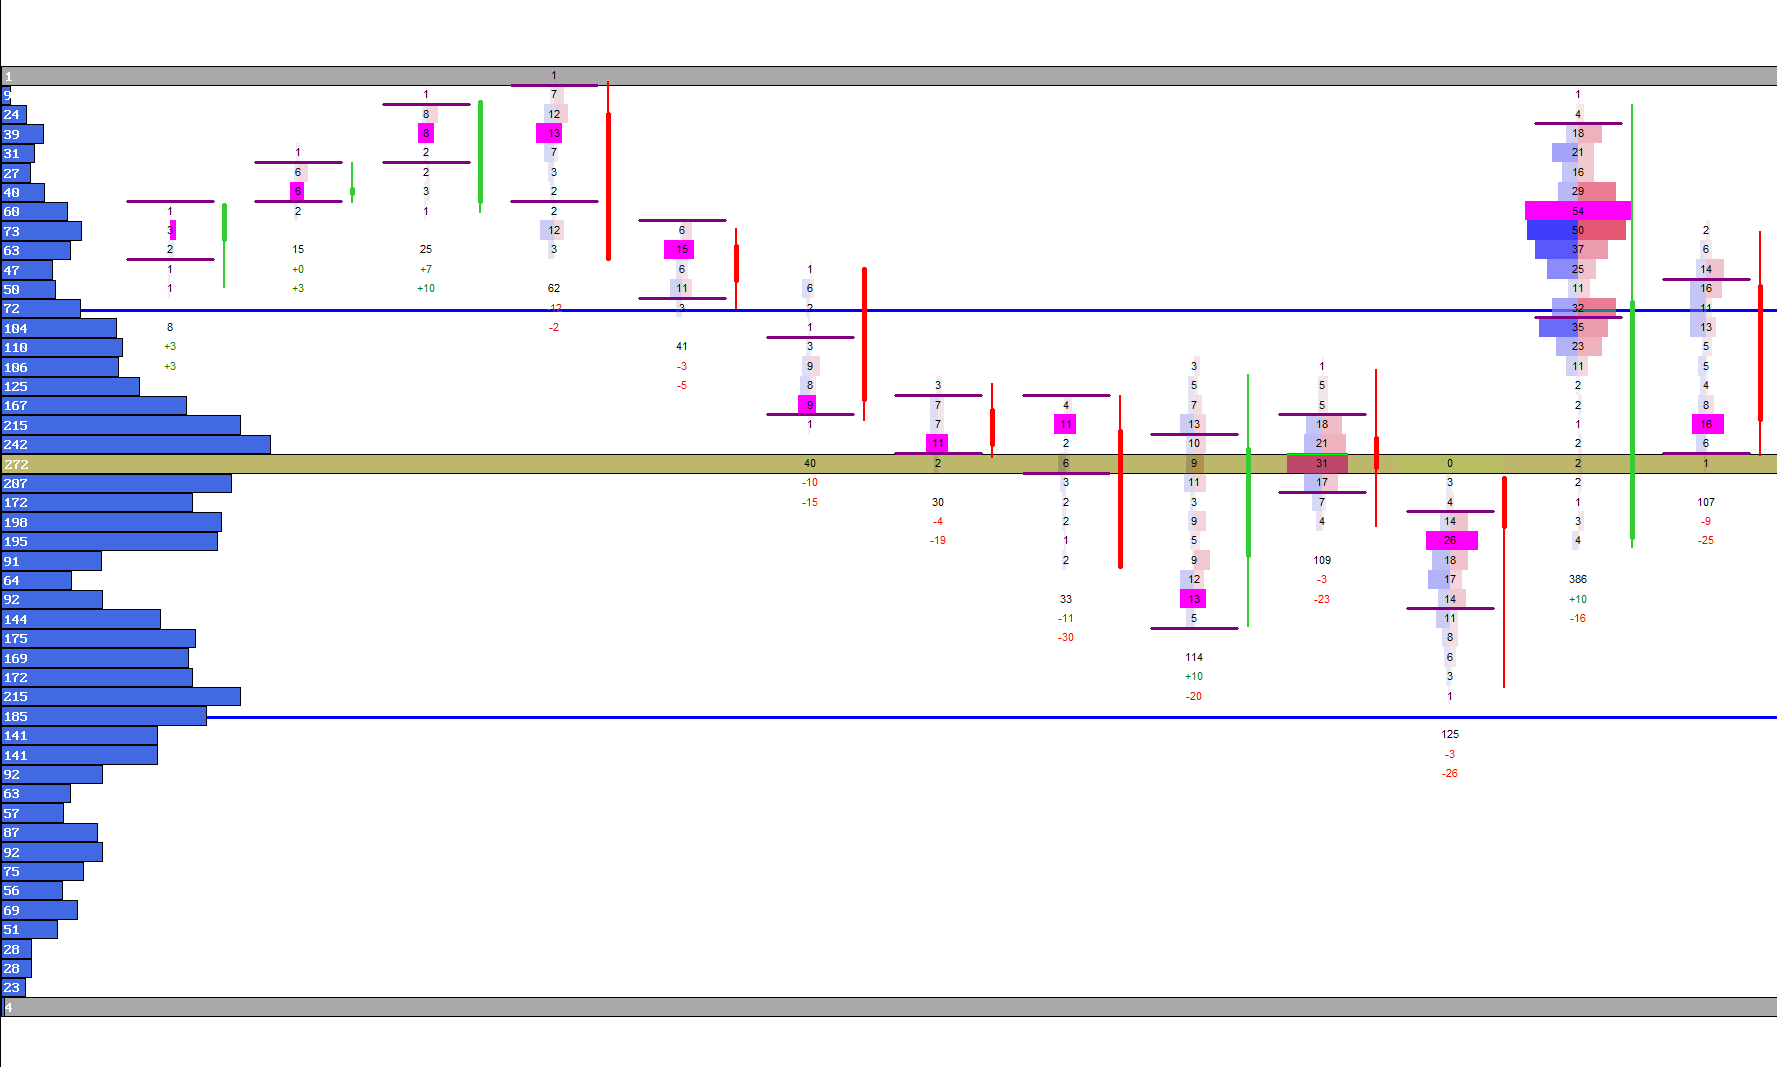
| Minimalist Mode | Uses a thin, unobtrusive line for low‑noise chart layouts. |
| Dynamic POC | Updates the POC live as new volume accumulates during the session. |
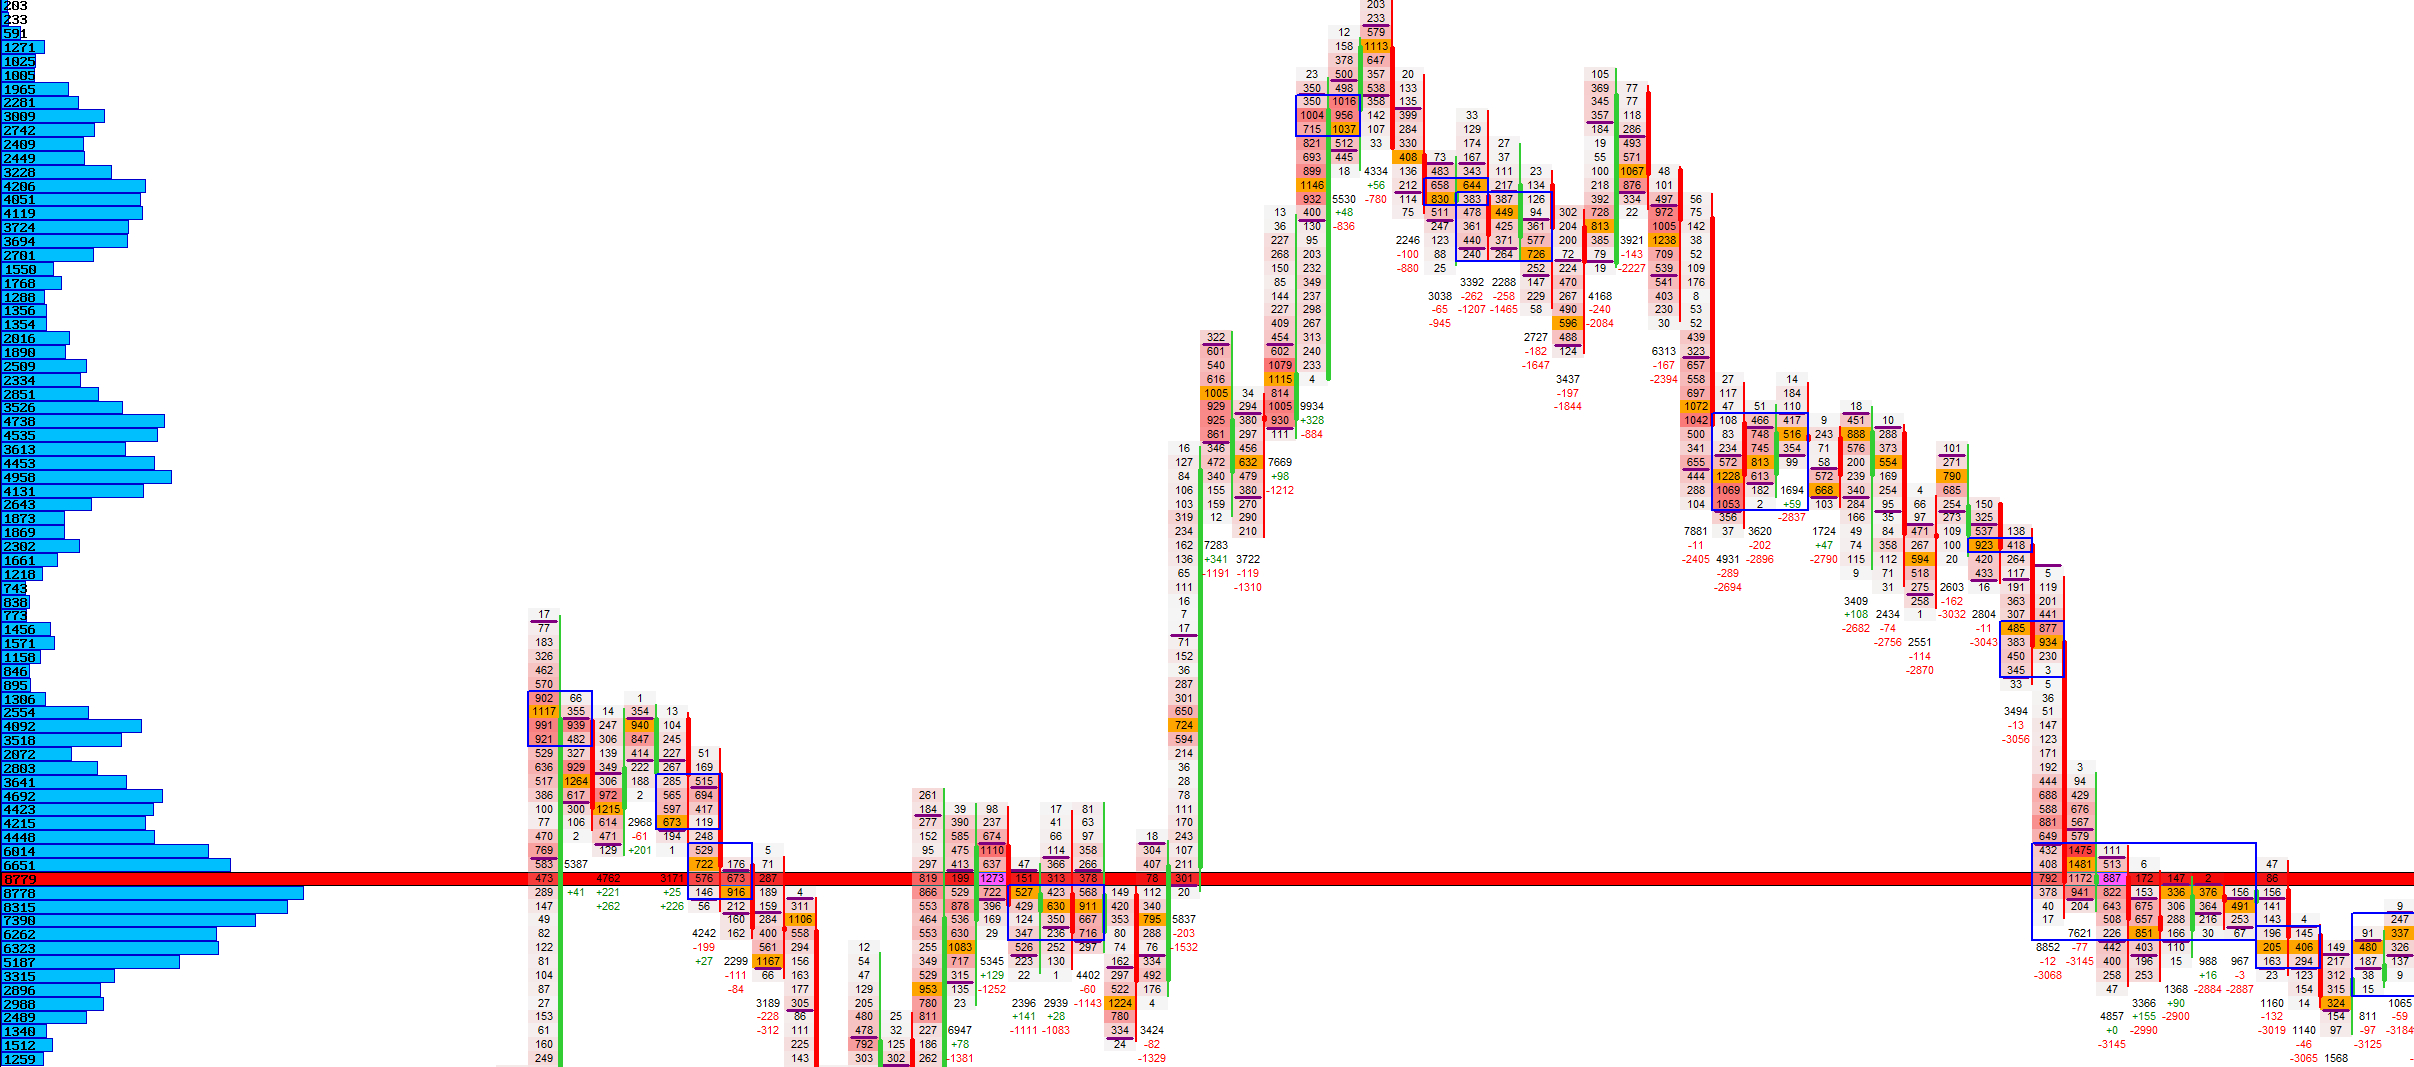
Visual Example: POC Line
POC Volume
See how much volume accumulated at the strongest price level.
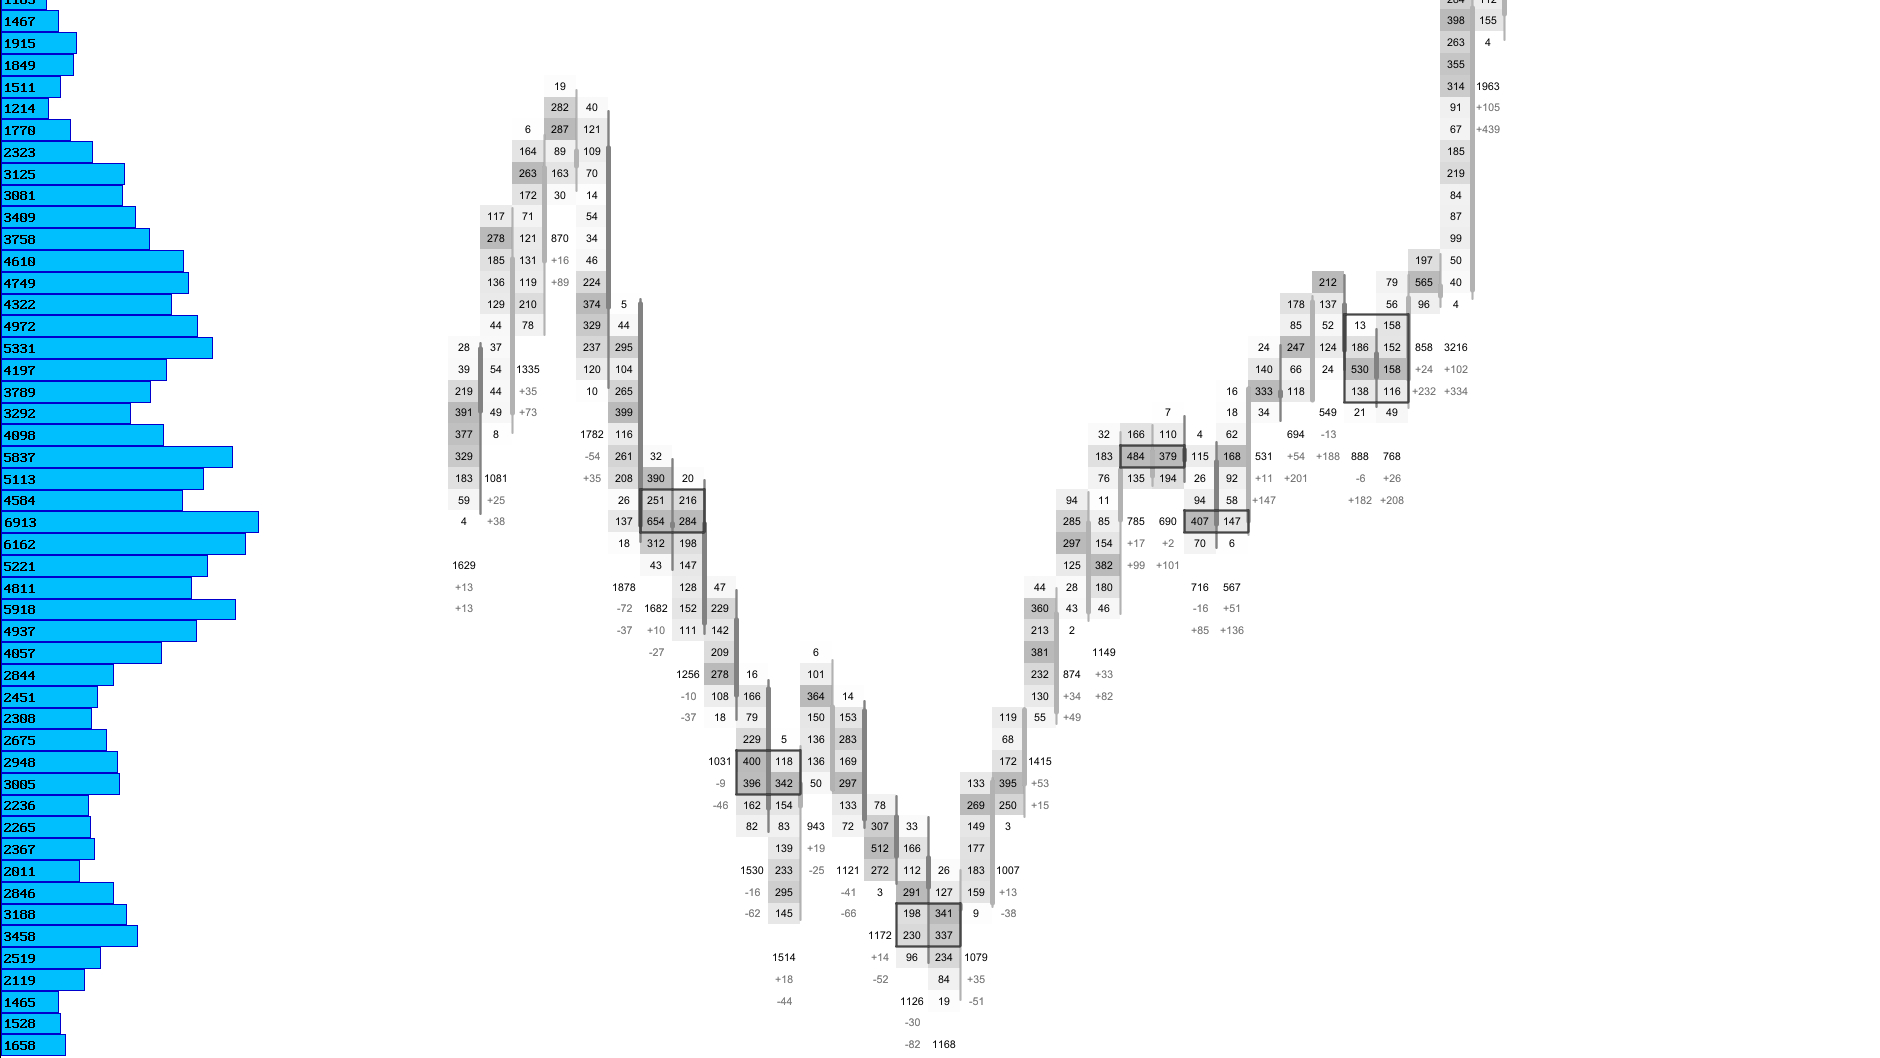
The POC is not only a price level — it also represents the point of maximum participation. The volume accumulated at the POC is displayed directly inside the Volume Profile, allowing you to compare it with surrounding price levels.
A strong POC often indicates a stable auction where buyers and sellers agreed on value. A weak or shifting POC can signal imbalance, trend development or a change in market sentiment.
Visual Example: POC Volume
POC Behavior
How price interacts with the POC during balance and trend phases.
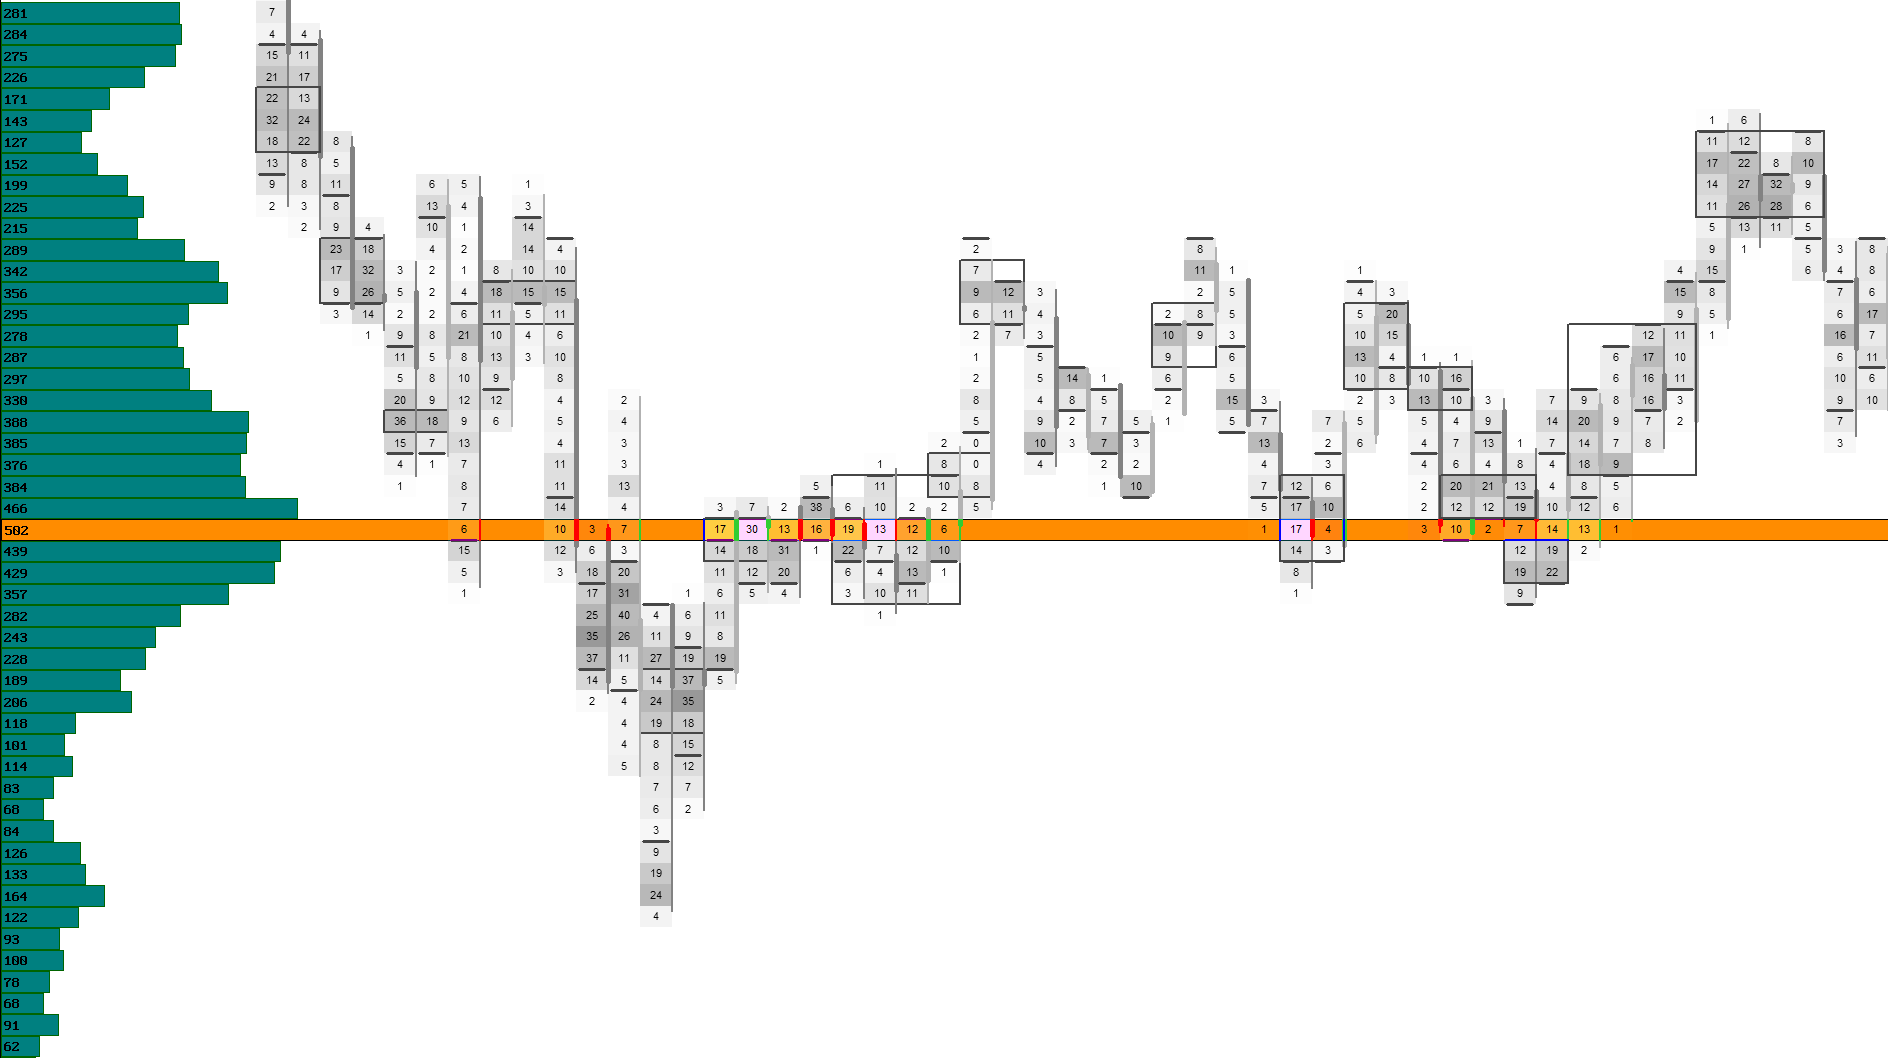
In balanced markets, price often oscillates around the POC, repeatedly returning to it as the auction seeks fair value. This creates a stable structure where the POC acts as a gravitational center.
In trending markets, price may move away from the POC and build new high‑volume areas higher or lower. When this happens, the POC can shift, revealing where the market is accepting new value.
Watching how price behaves around the POC helps you understand whether the market is balanced, transitioning or trending — a key insight for timing entries and exits.
Next Chapters
Continue exploring the core modules of Footprint‑Secrets.