Pivot Points
Classic intraday support and resistance levels derived from the previous session’s high, low and close.
Pivot Points provide a structured framework of intraday support and resistance levels based on the previous session’s price range. These levels are widely monitored by institutional and algorithmic traders and help you anticipate where price may react, stall or accelerate during the current session.
By combining the central Pivot Point (PP) with three resistance levels (R1–R3) and three support levels (S1–S3), you gain a clear map of potential reaction zones that complement footprint and volume‑based analysis.
Pivot Point (PP)
The central reference level derived from the previous session’s high, low and close.
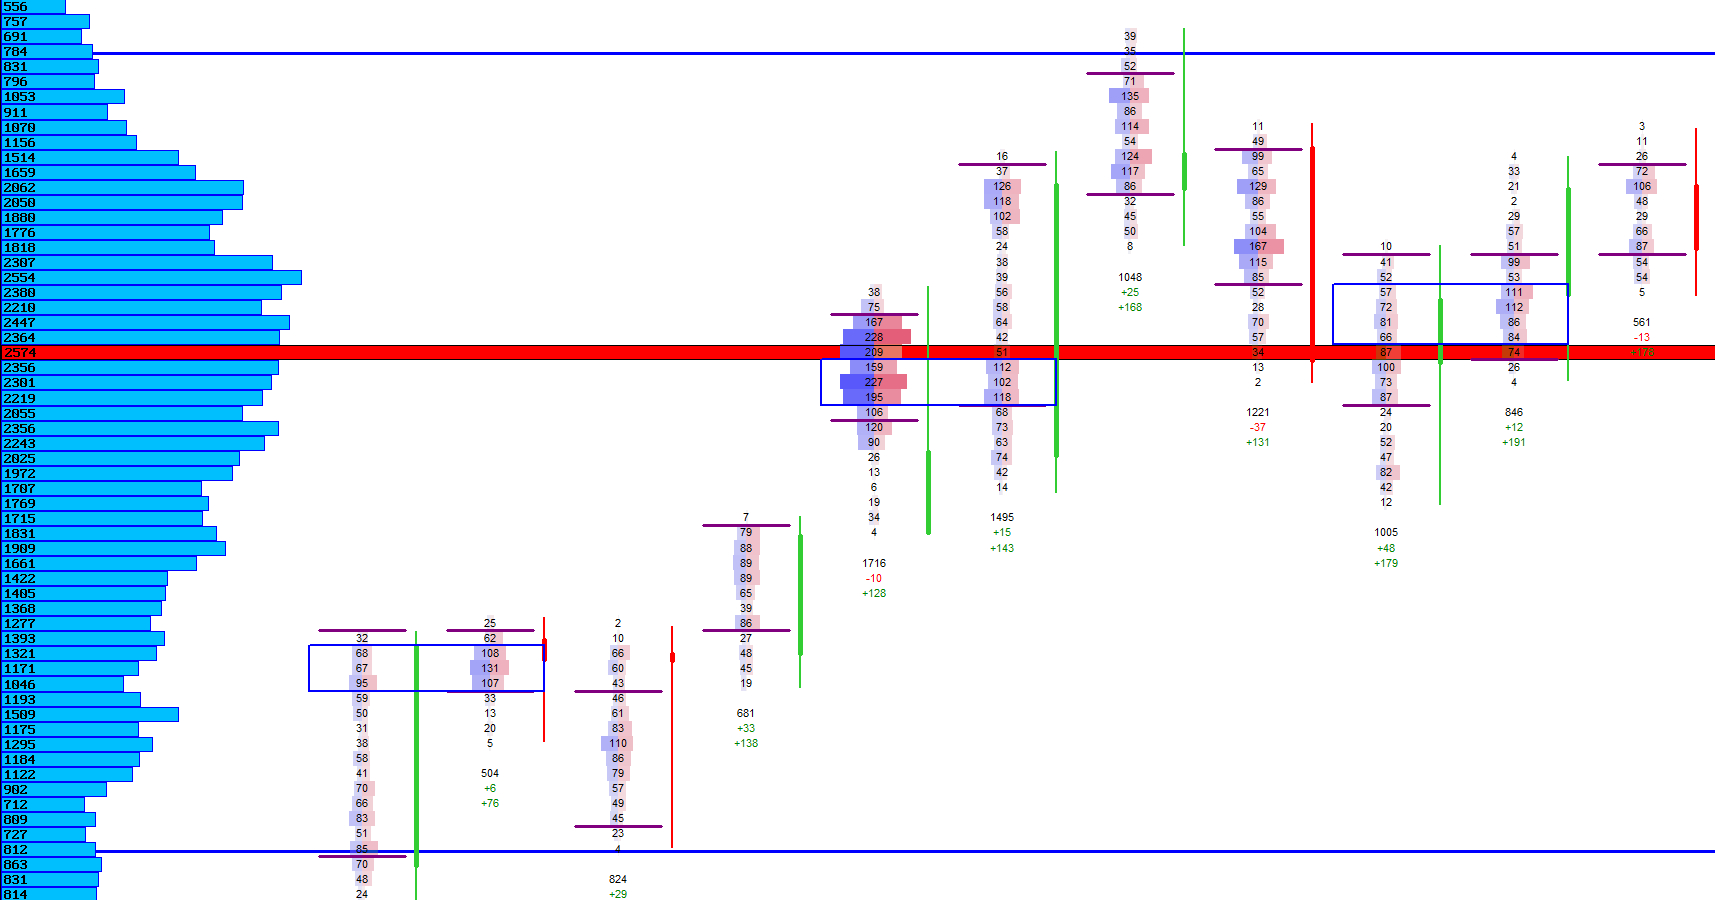
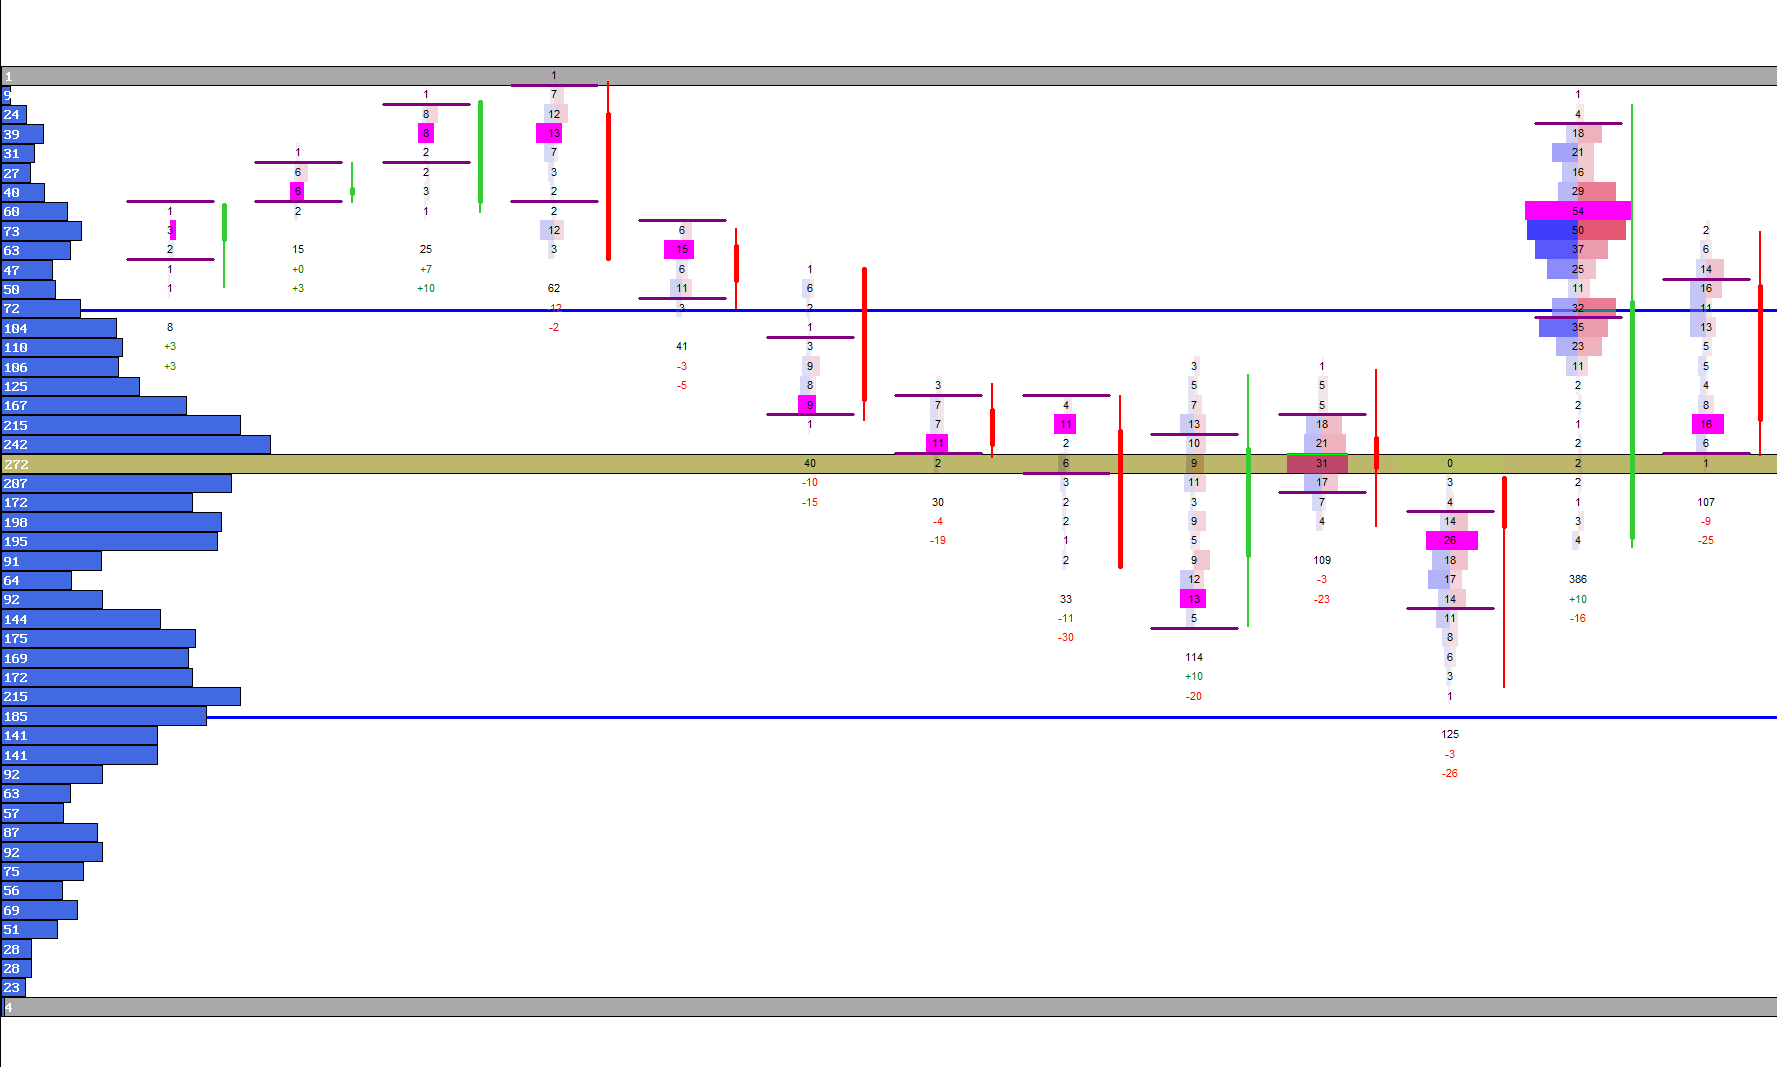
The central Pivot Point (PP) is calculated as the average of the previous session’s high, low and close. It acts as the primary fair‑value reference for the current session. When price trades above PP, the market is often considered bullish; when it trades below, bearish sentiment may dominate.
PP is drawn as a horizontal line across the chart and remains aligned with the footprint’s price axis, ensuring a clean and consistent visual structure.
Resistance Levels (R1, R2, R3)
Upside reference levels derived from the previous session’s range.
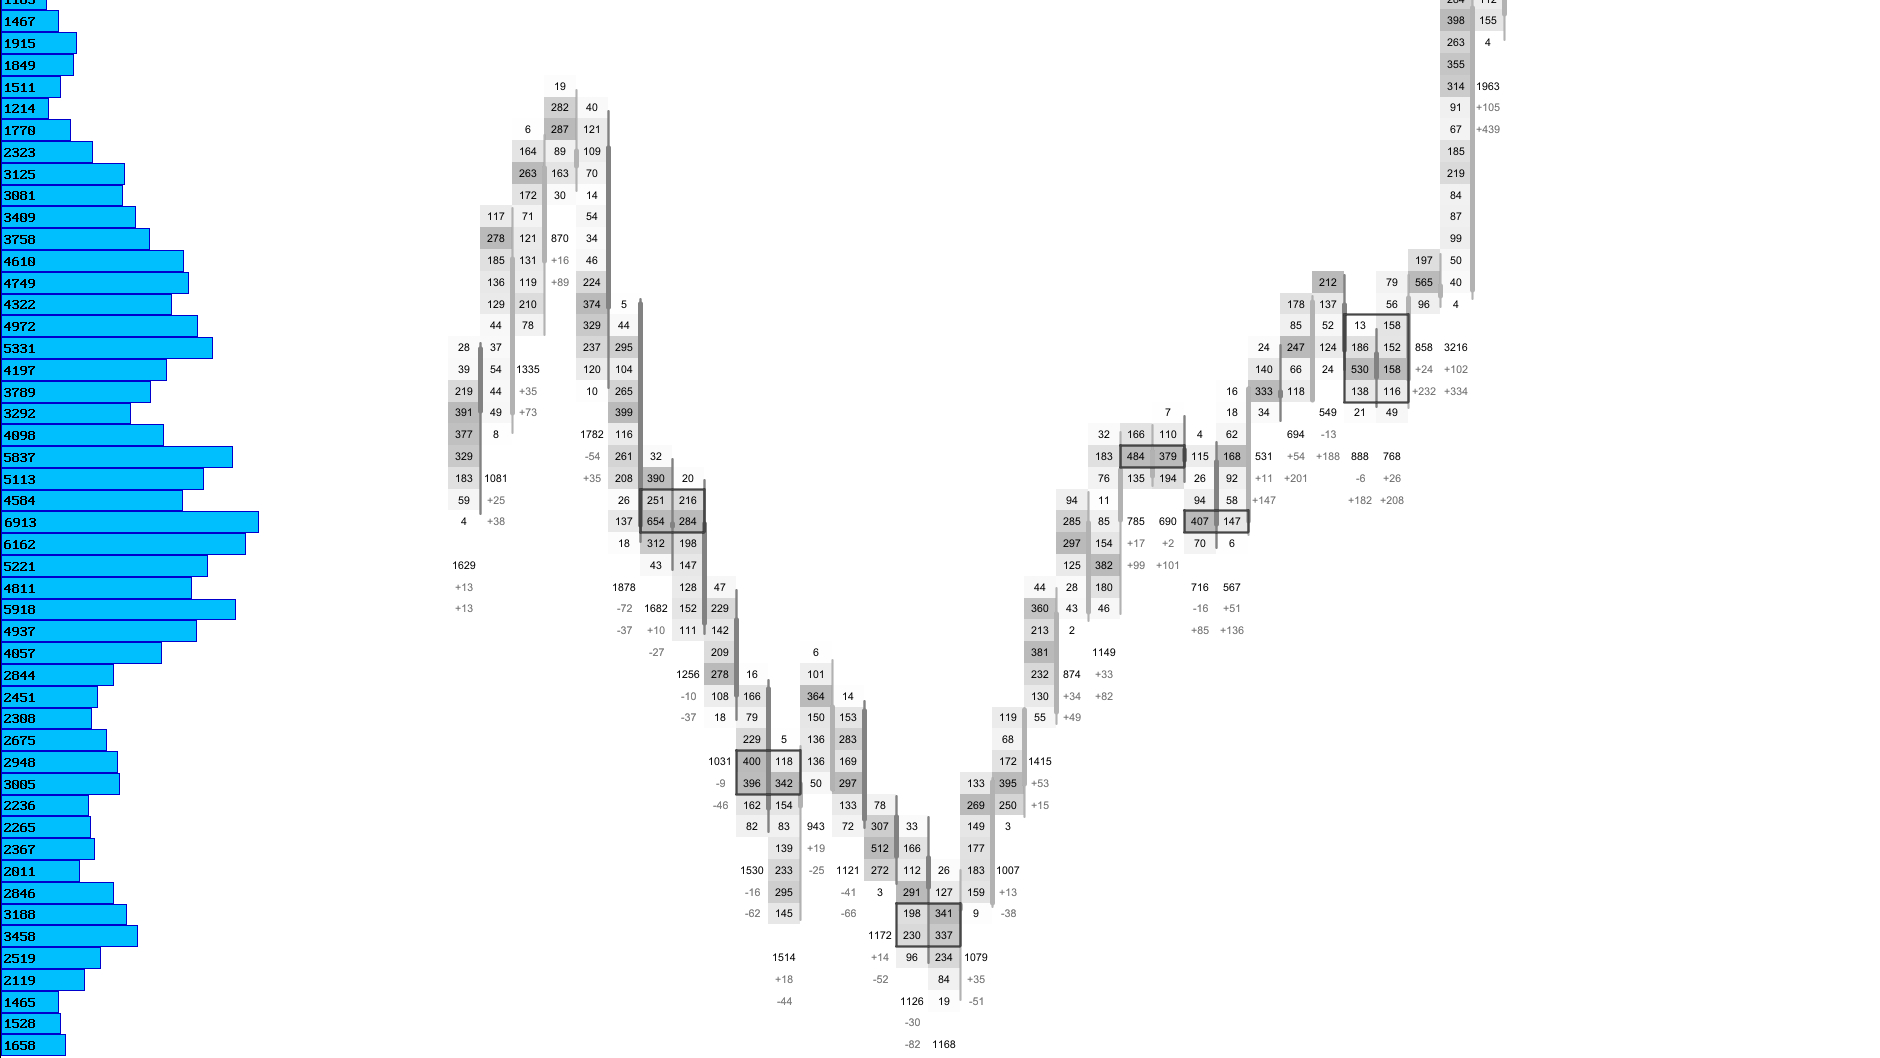
The resistance levels R1, R2 and R3 are calculated from the previous session’s price range. They represent potential upside reaction zones where price may stall, reverse or accelerate.
These levels are widely used by intraday traders to anticipate breakout attempts, exhaustion points and areas where liquidity may cluster.
Resistance Modes
| Mode | Description |
|---|---|
| Standard R‑Levels | Draws R1, R2 and R3 as clear horizontal resistance markers. |
| Minimalist Resistance | Uses thin lines for a clean, unobtrusive layout. |
| Directional Coloring | Highlights resistance levels with dedicated bullish‑side colors. |
Support Levels (S1, S2, S3)
Downside reference levels derived from the previous session’s range.
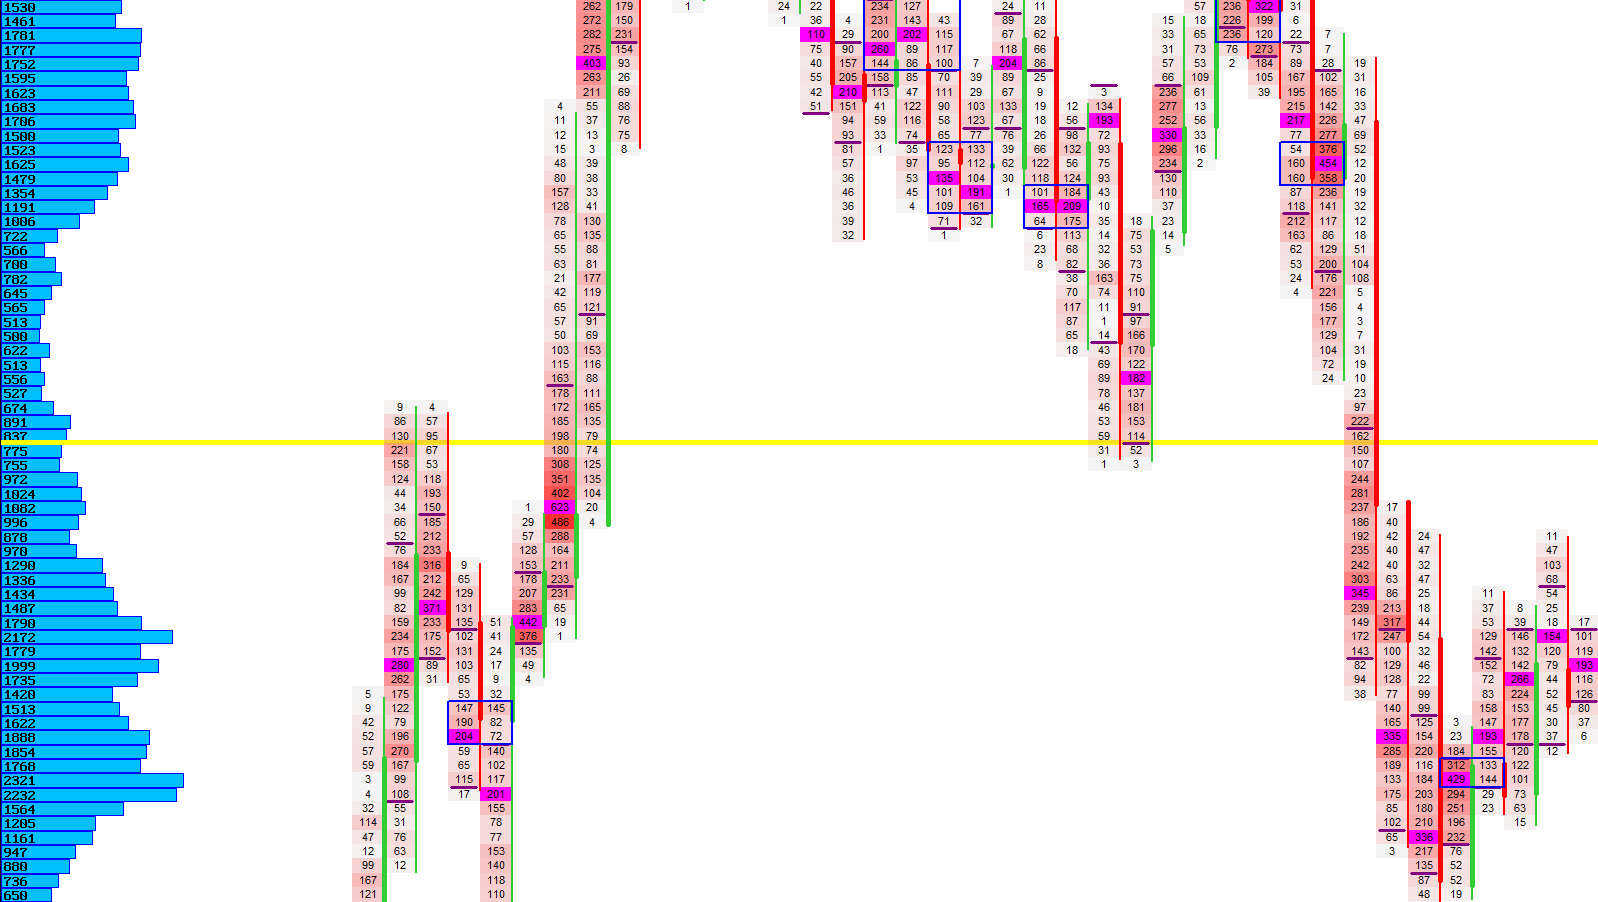
The support levels S1, S2 and S3 mirror the resistance structure on the downside. They mark potential reaction zones where price may find buyers, pause or reverse.
These levels help you anticipate where the market may defend value or where aggressive selling could push through to explore lower prices.
Support Modes
| Mode | Description |
|---|---|
| Standard S‑Levels | Draws S1, S2 and S3 as clear horizontal support markers. |
| Minimalist Support | Uses thin lines for a clean, low‑noise layout. |
| Directional Coloring | Highlights support levels with dedicated bearish‑side colors. |
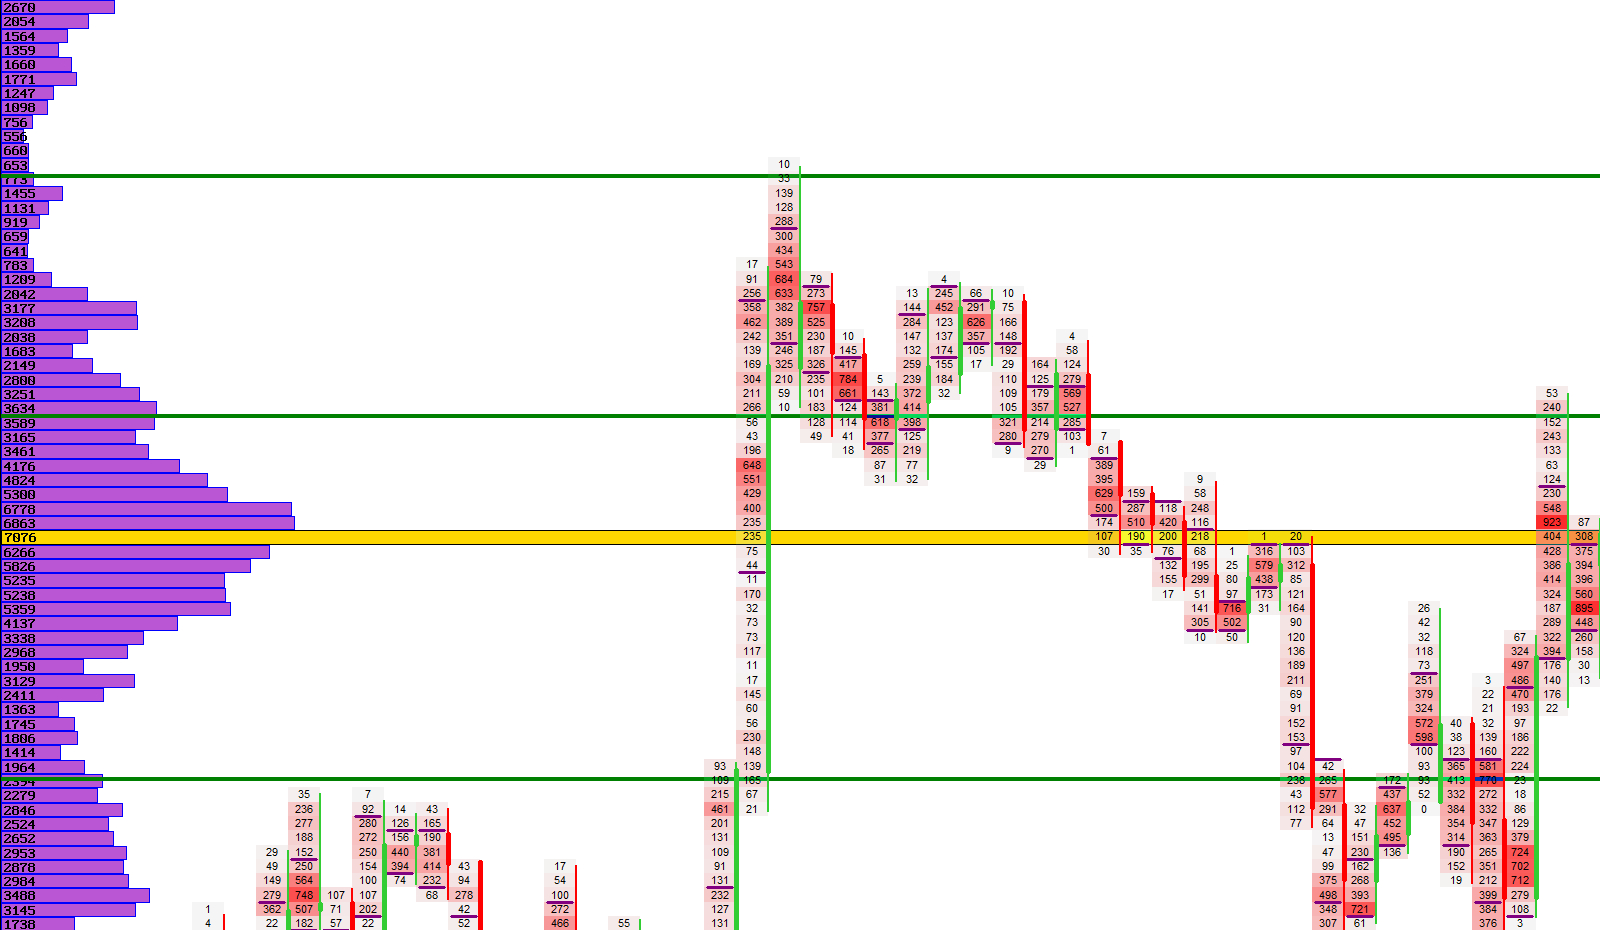
Visual Example: Support Levels
Next Chapters
Continue exploring the core modules of Footprint‑Secrets.