Volume & Delta Heatmap
A high‑clarity visual layer that exposes pressure, intensity, and dominance at every price level.
Market pressure is not visible in standard candles. The Heatmap reveals how aggressively buyers and sellers interact at each price level. It highlights volume intensity, delta pressure, and bid/ask dominance directly inside the footprint, making shifts in market behavior instantly visible.
This provides immediate context for absorption, aggressive sweeps, trapped traders, exhaustion, and breakout strength — insights that standard candles simply cannot provide.
Heatmap Modes
Three visualization modes that reveal intensity, dominance, and participation.
The Heatmap offers multiple visualization modes, each designed to highlight a different aspect of market behavior. Whether you want to see raw volume intensity, directional aggression, bid/ask dominance, or candle‑relative activity — each mode provides a unique layer of clarity.
Available Modes
| Mode | Description |
|---|---|
| Volume Mode | Shows how active each price level is relative to typical activity. |
| Delta Mode | Highlights whether buyers or sellers are in control, with optional adaptive scaling. |
| Bid/Ask Mode | Colors bid‑ and ask‑volume separately to reveal imbalances and pressure zones. |
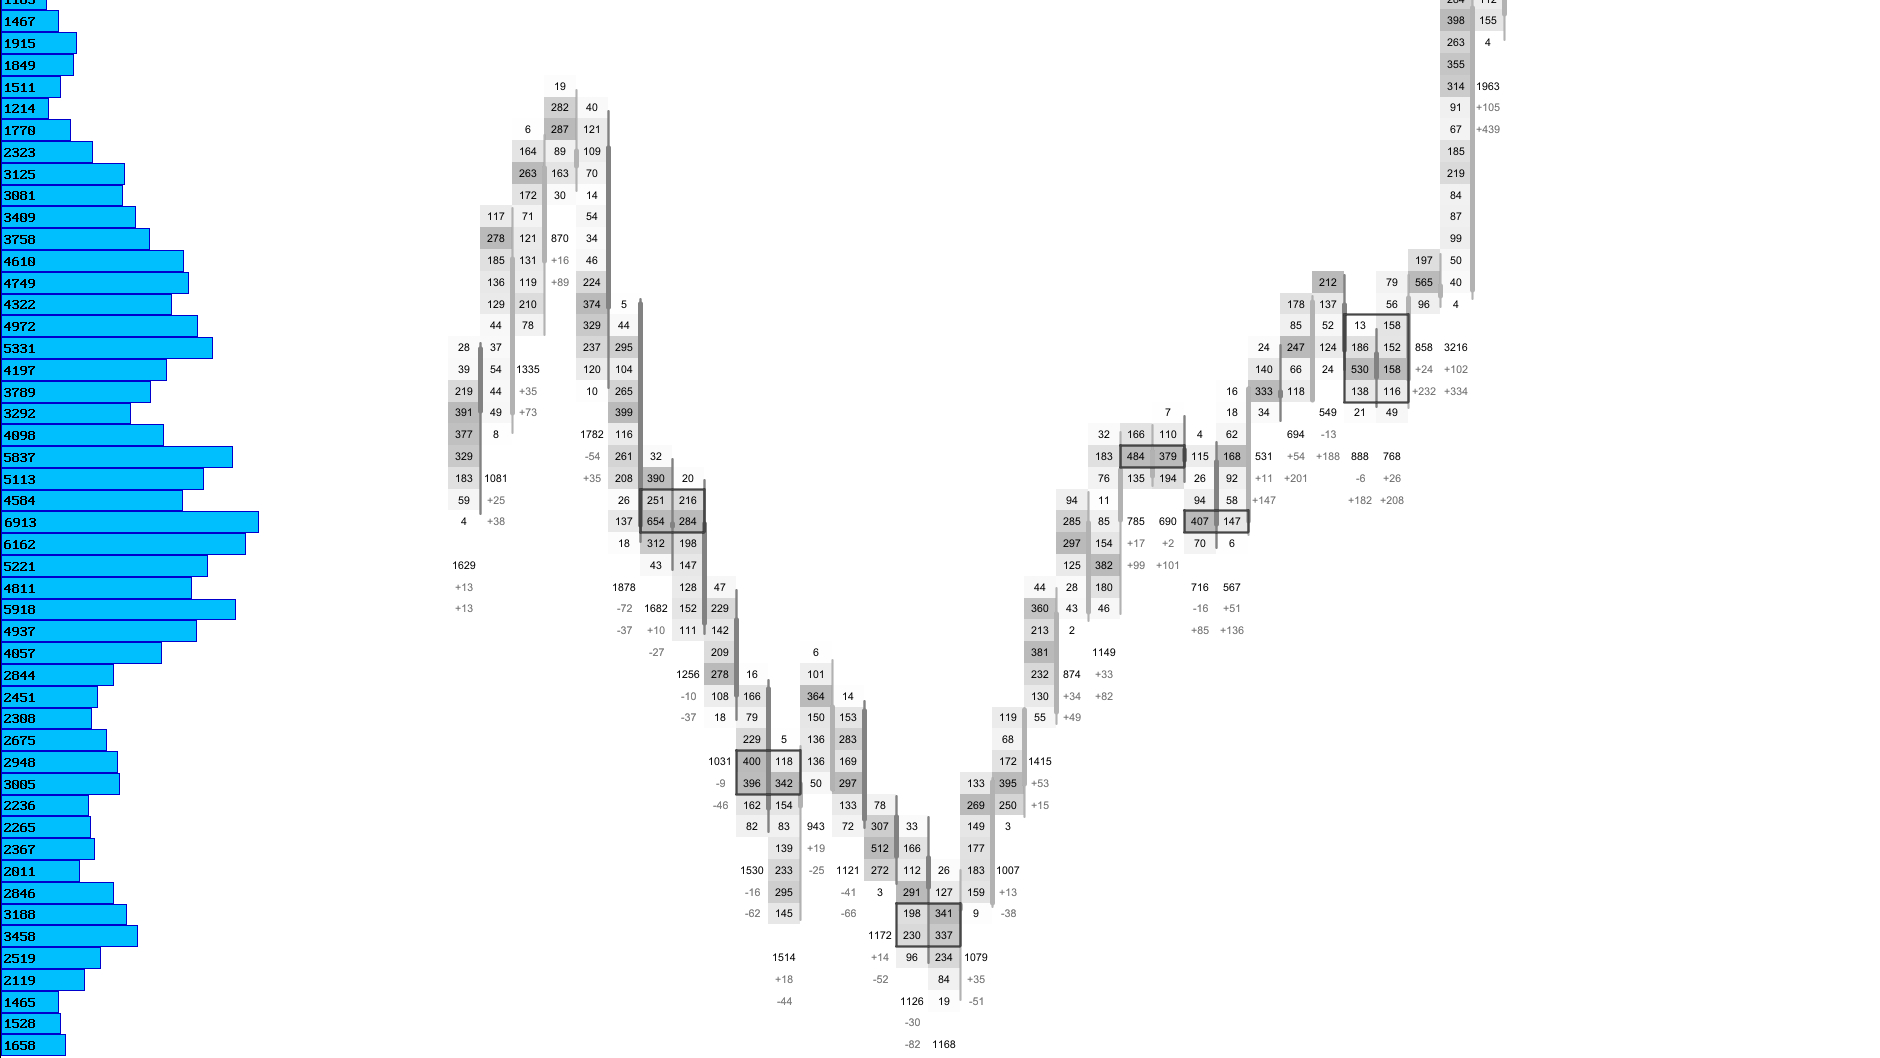
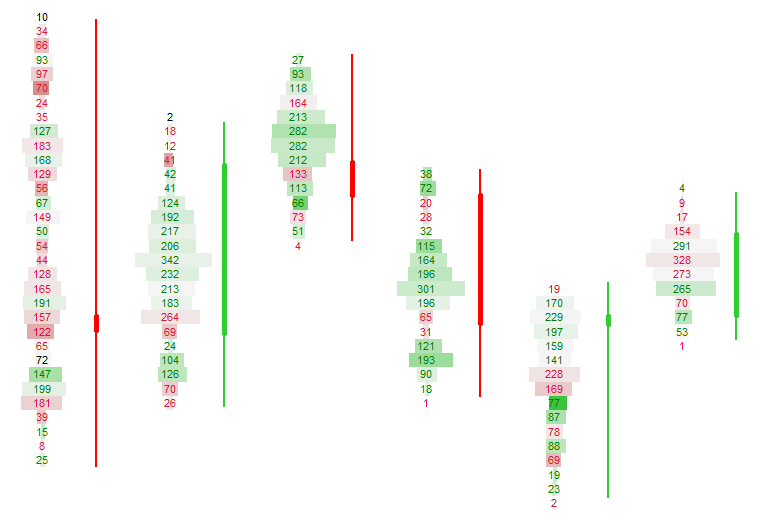
Volume Heatmap
Highlights unusually high or low traded volume at each price level.
The Volume Heatmap shows how much activity occurred at each price level. High‑volume areas are highlighted using stronger colors, while low‑volume areas remain neutral. The heatmap adapts to the average and maximum traded volume of the session, ensuring that colors remain meaningful even during high‑ or low‑volatility periods.
Visual Example: Volume Heatmap
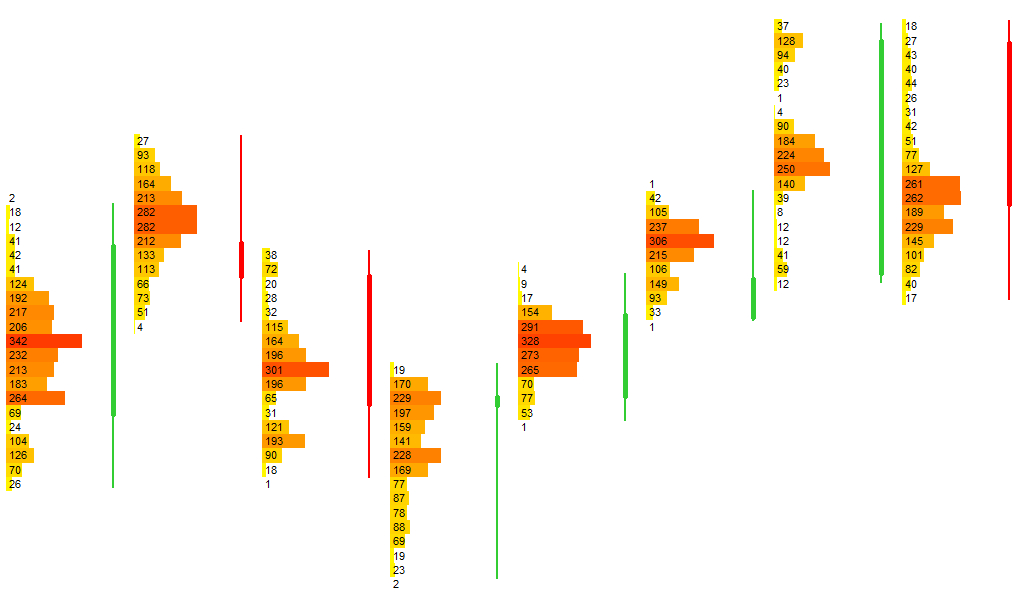
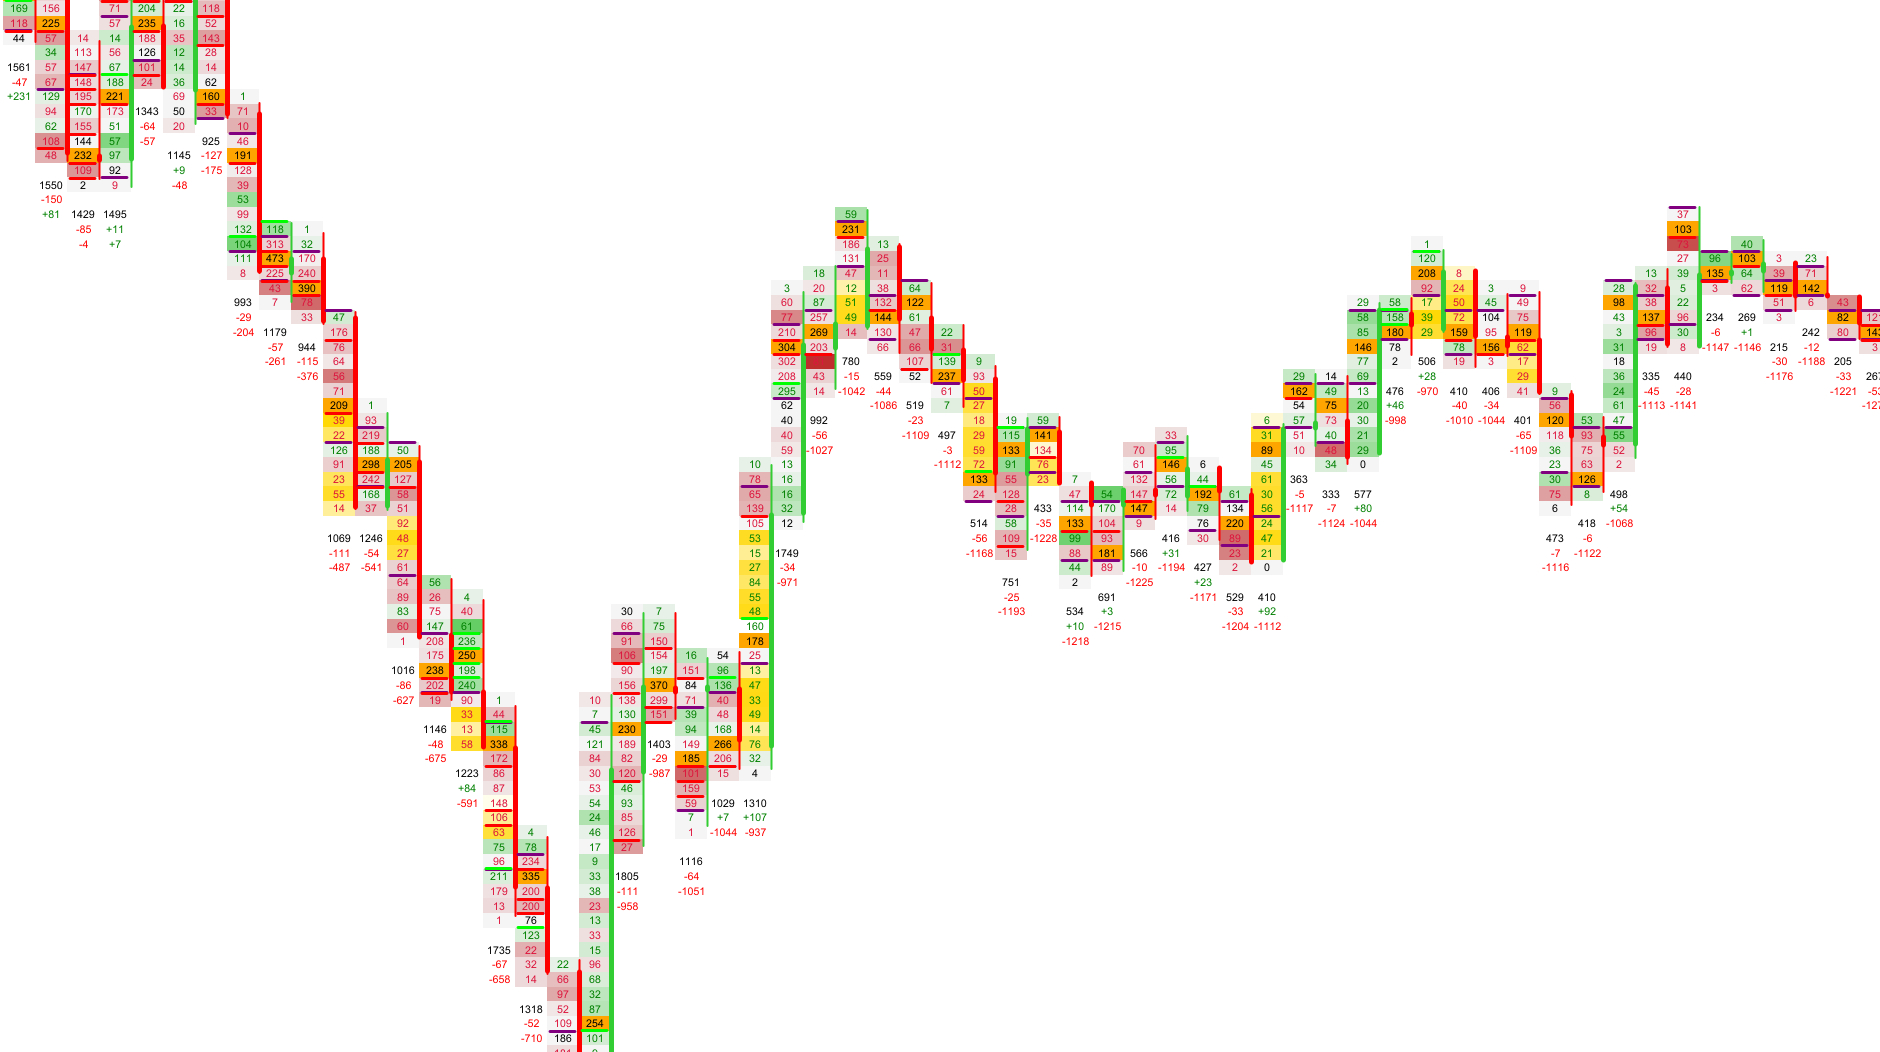
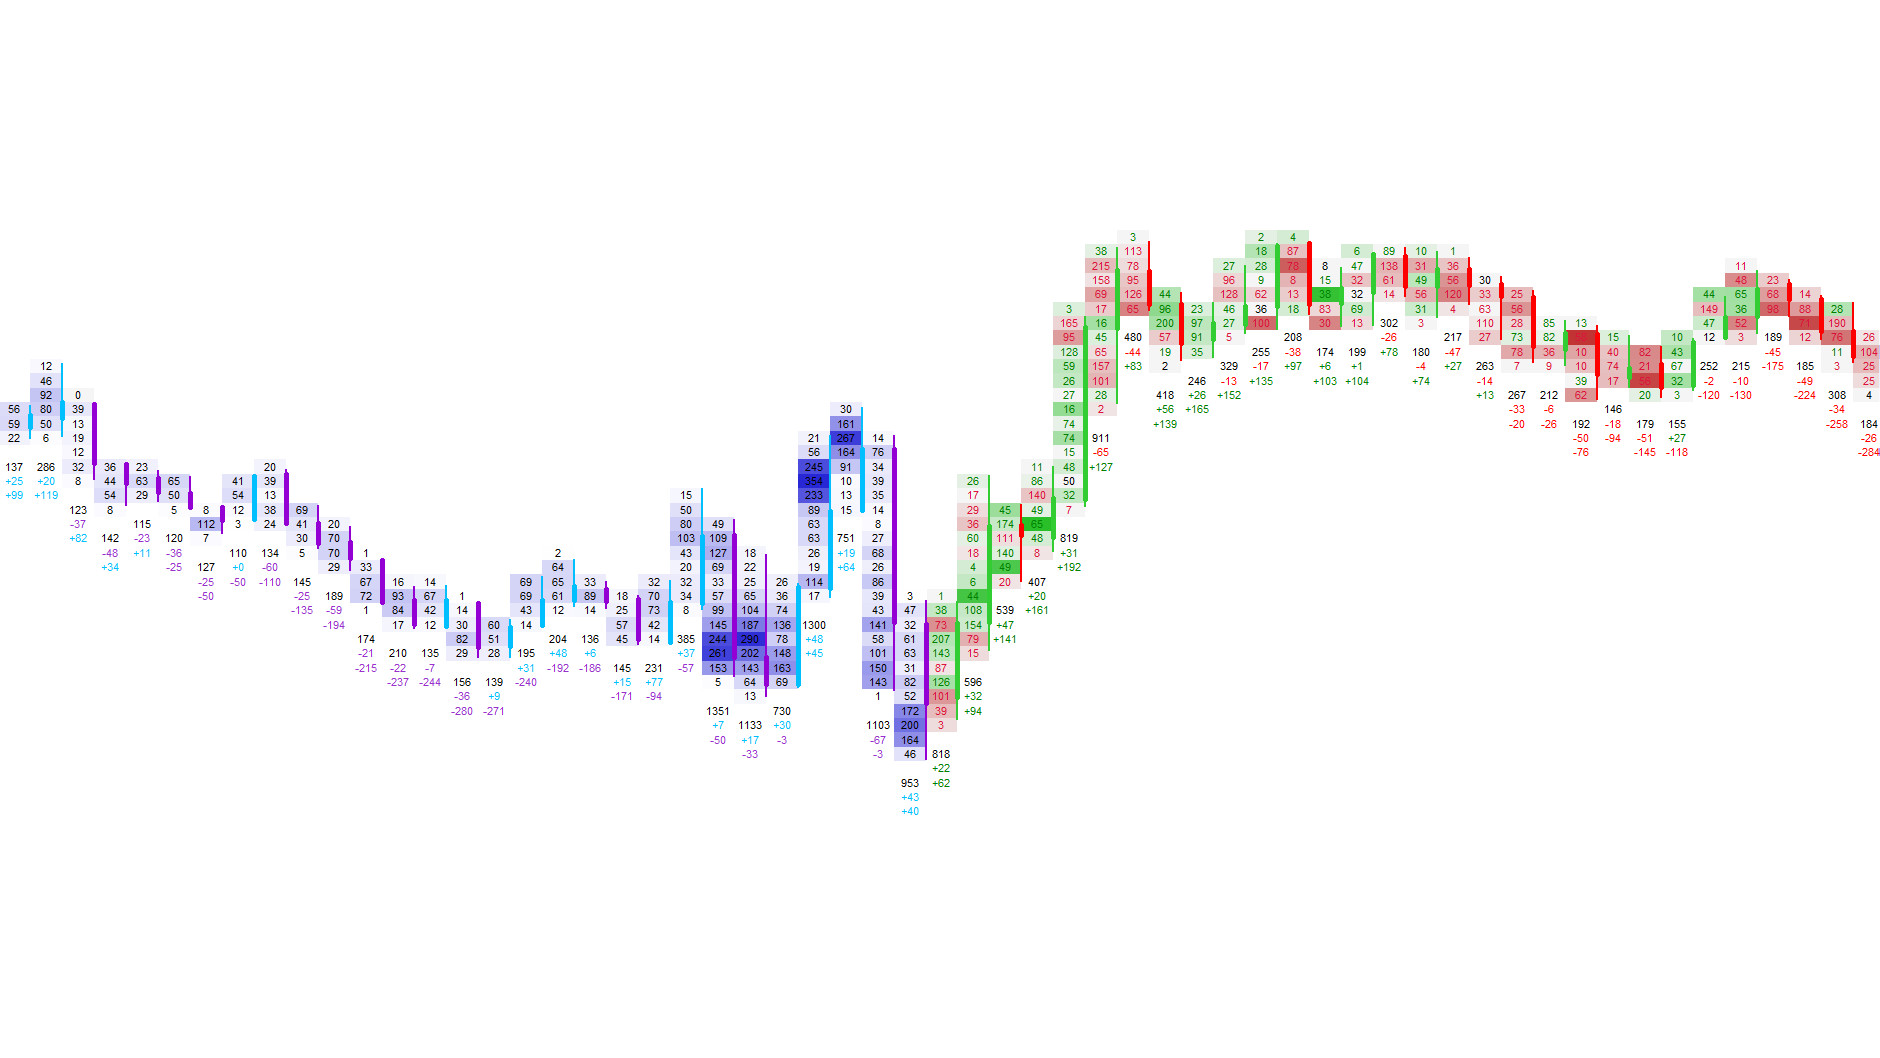
Delta Heatmap
Shows whether aggressive buyers or sellers dominated at each price level.
The Delta Heatmap highlights the balance between aggressive buyers and sellers at each price level. Positive delta (ask‑side aggression) is shown using warm tones, while negative delta (bid‑side aggression) is shown using cooler tones.
When Adaptive Mode is enabled, delta intensity is scaled by the traded volume at that price level. This prevents misleading spikes and ensures that delta intensity always reflects both direction and participation.
Visual Example: Delta Heatmap
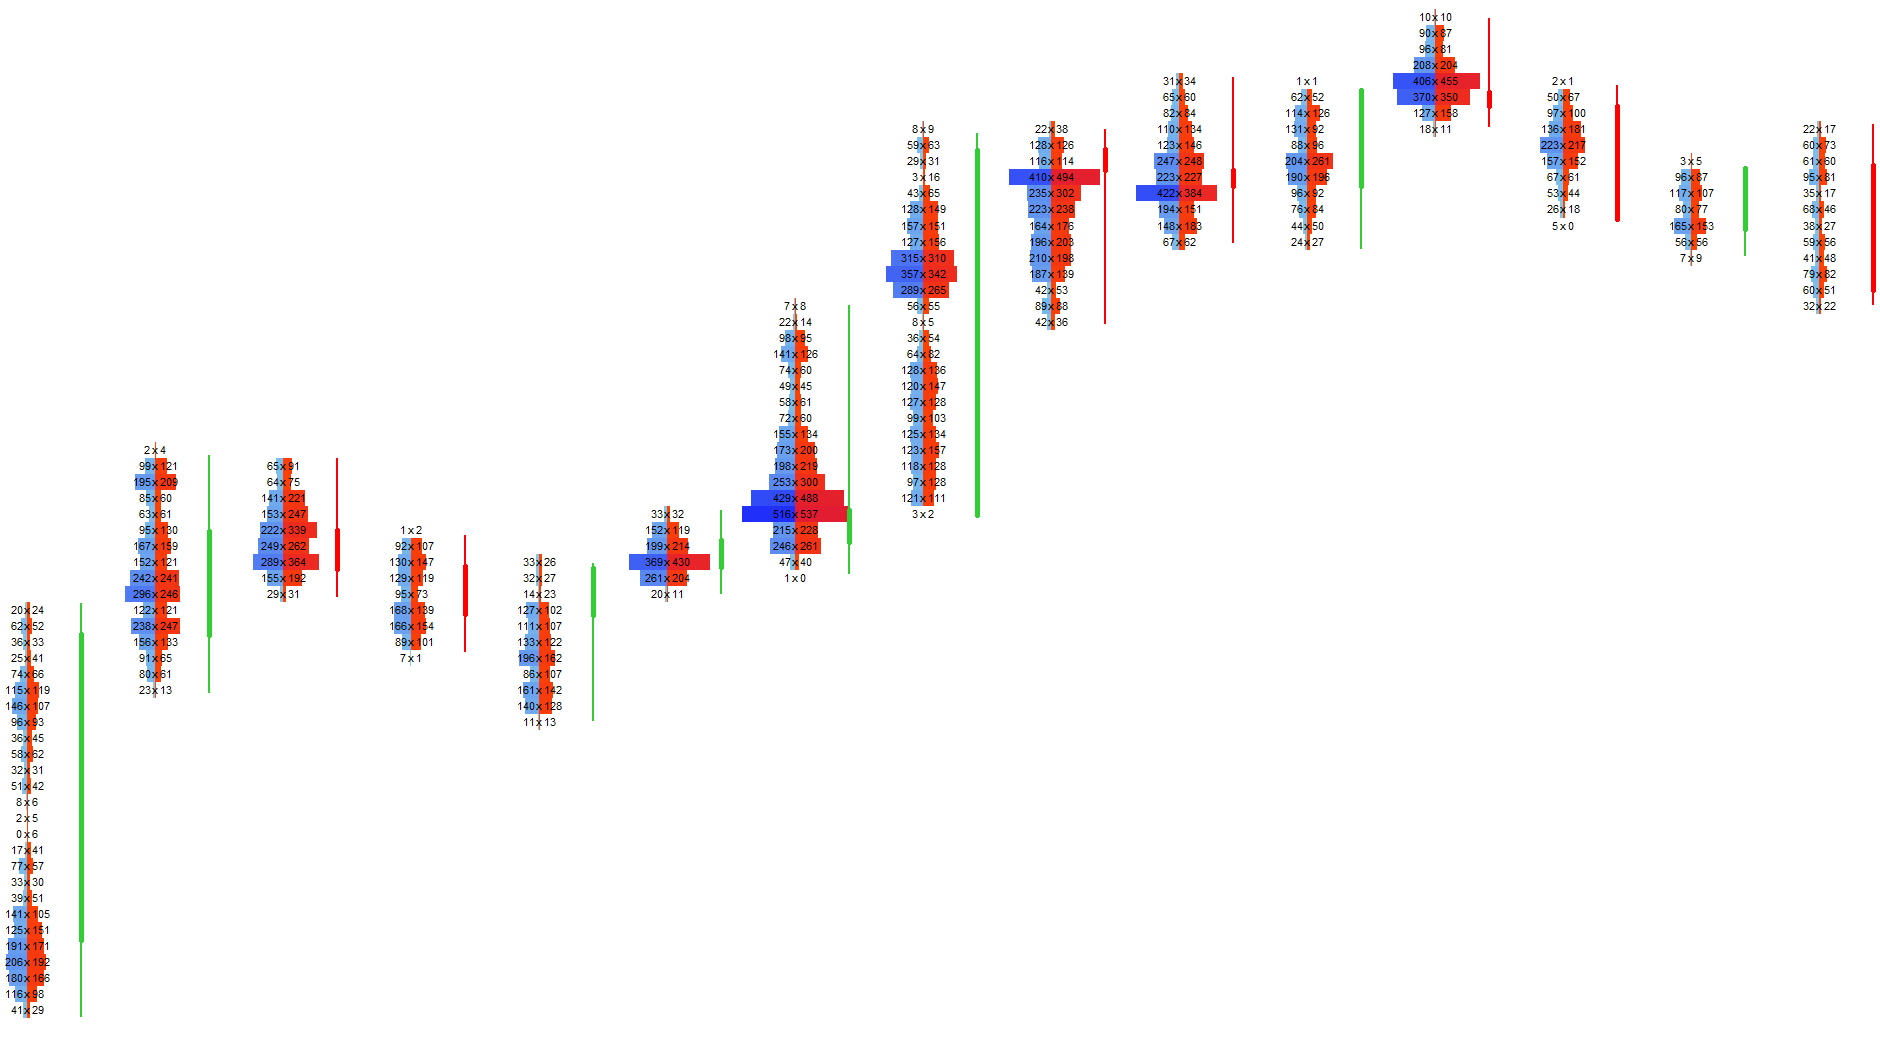
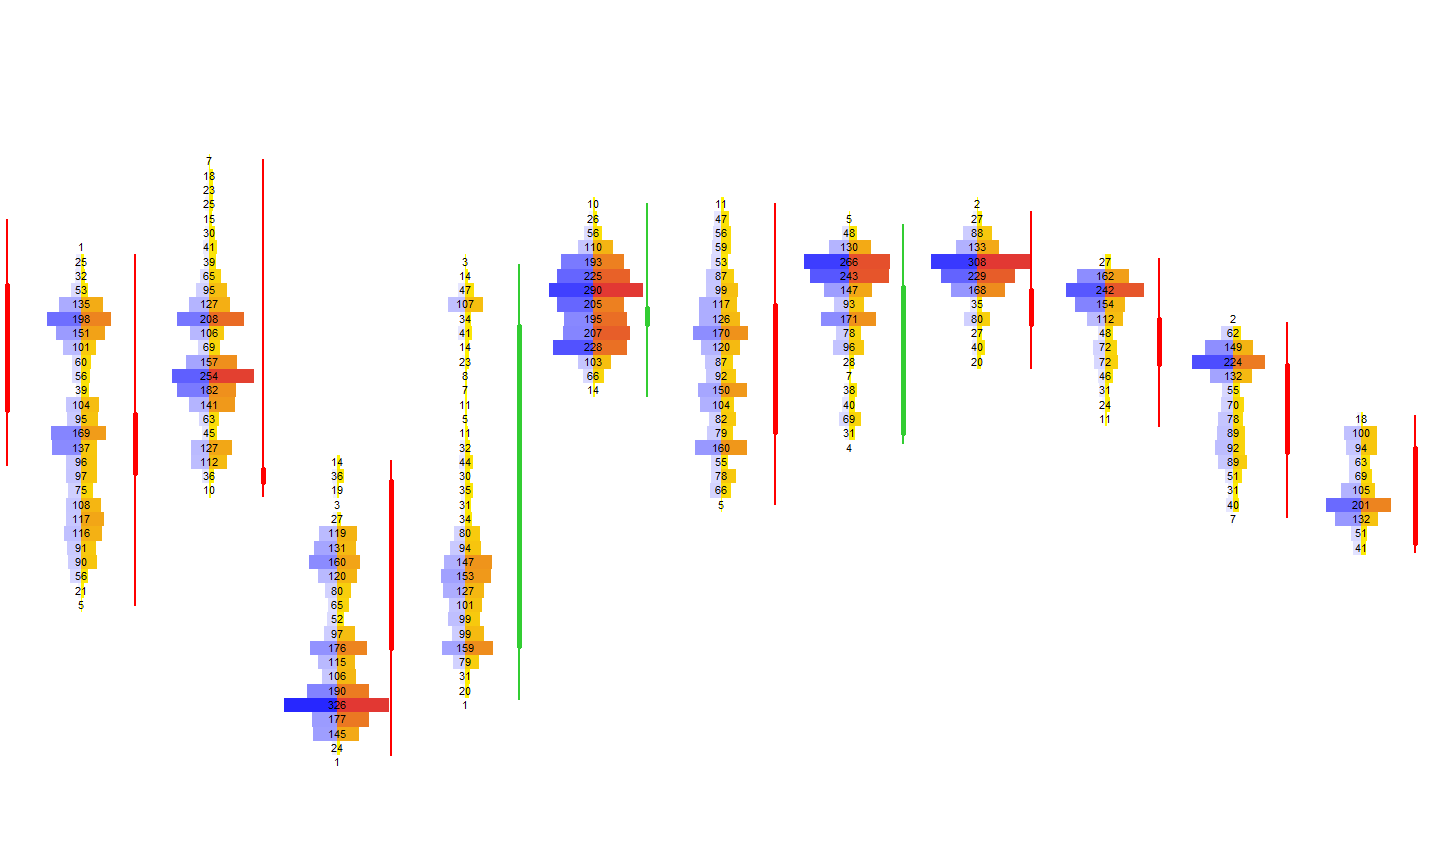
Bid/Ask Heat Coloring
Special heat coloring used inside Bid × Ask Volume Bars Mode.
When using the Bid × Ask Volume Bars Mode, the footprint can apply a dedicated heat coloring scheme to highlight the intensity of bid‑side and ask‑side volume separately. This allows you to instantly see which side of the market was more active at each price level.
Visual Example: Bid/Ask Heat Coloring
Next Chapters
Continue exploring the core modules of Footprint‑Secrets.