Candle Features
Enhanced candlesticks that blend classic price action with footprint‑level microstructure.
Candle Features upgrade traditional candlesticks with footprint‑level context, micro‑POC markers, per‑candle value areas, volume bars and a compact summary panel. Each candle becomes a precise, information‑dense representation of internal structure — without losing the clarity of a classic chart.
Whether you trade reversals, rotations, breakouts or structural shifts, these enhanced candles reveal how price behaved inside each bar and where liquidity concentrated.
Candle Body & Wicks
Classic candlesticks aligned with the footprint’s custom time axis.
The candlestick overlay adds a familiar price‑action layer on top of the footprint. Each candle uses the same open, high, low and close derived from the underlying tick stream — including synthetic bridge candles when no price-action occured.
Bullish, bearish and neutral candles are color‑coded for instant recognition. You can choose whether candles appear on the left or right side of the footprint and adjust body and wick thickness to match your preferred visual style.
Available Options
| Option | Description |
|---|---|
| Bull / Bear / Doji Colors | Clear visual distinction between bullish, bearish and neutral candles. |
| Candle Width | Adjust the thickness of the candle body for optimal readability. |
| Wick Width | Control the thickness of upper and lower wicks. |
| Candle Side | Choose whether candles appear on the left or right of the footprint. |
Visual Example: Candle Body & Wicks
POC per Candle
Identify the strongest traded price level inside each candle.
Each candle can display its own Point of Control — the price level with the highest traded volume inside that candle. This micro‑POC reveals where liquidity concentrated within the bar and often acts as a short‑term magnet or pivot.
The POC marker is drawn directly within the candle and can be styled with custom colors and text formatting for maximum clarity.
Available Options
| Option | Description |
|---|---|
| POC Marker | Highlights the strongest traded price level inside the candle. |
| Custom Colors | Define marker and text colors for maximum visibility. |
VAH / VAL per Candle
Local value areas derived from intrabar volume distribution.
Micro‑value areas show where the majority of volume traded inside each candle. These levels reveal balance, rejection and internal structure that is invisible on standard candlesticks.
You can define how much of the candle’s volume forms the value area and adjust line thickness and vertical placement for a clean, unobtrusive look.
Available Options
| Option | Description |
|---|---|
| Value Area Percentage | Define how much of the candle’s volume forms the value area. |
| Line Thickness | Adjust the visual emphasis of VAH/VAL markers. |
| Vertical Offset | Position the value area markers around the candle. |
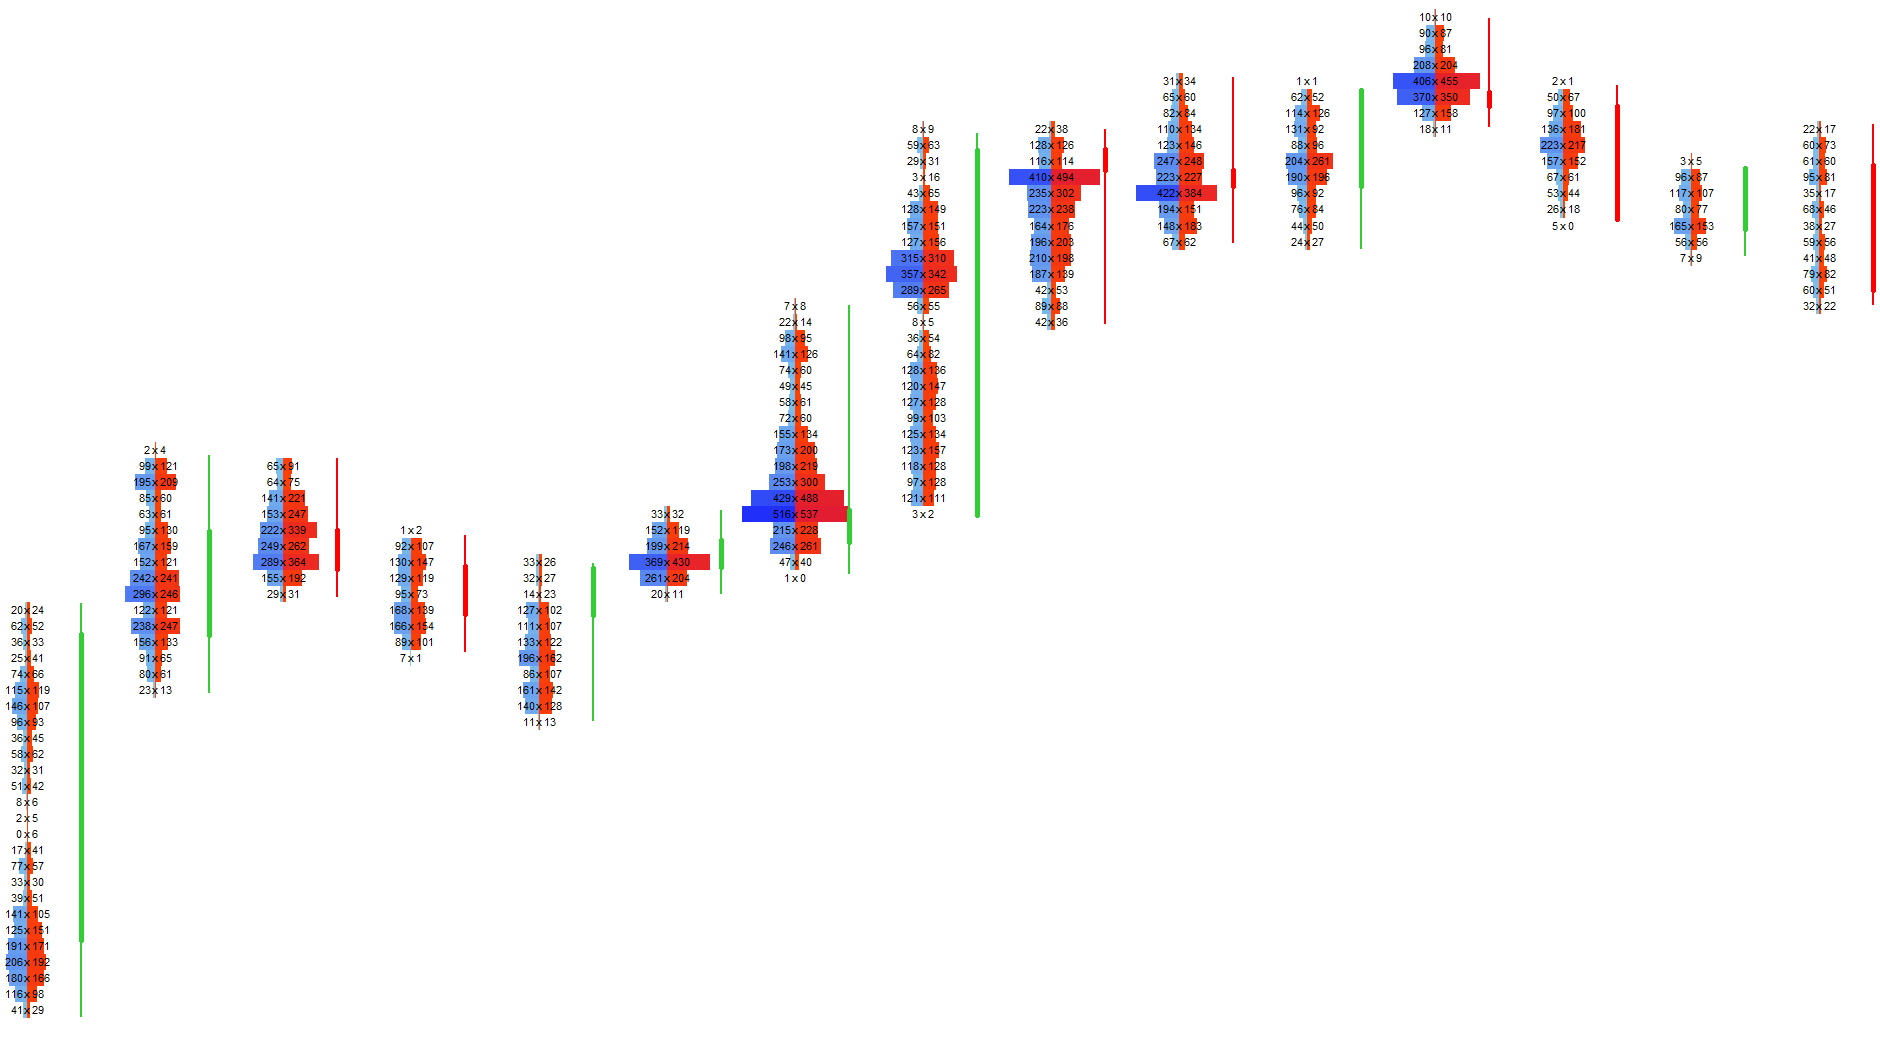
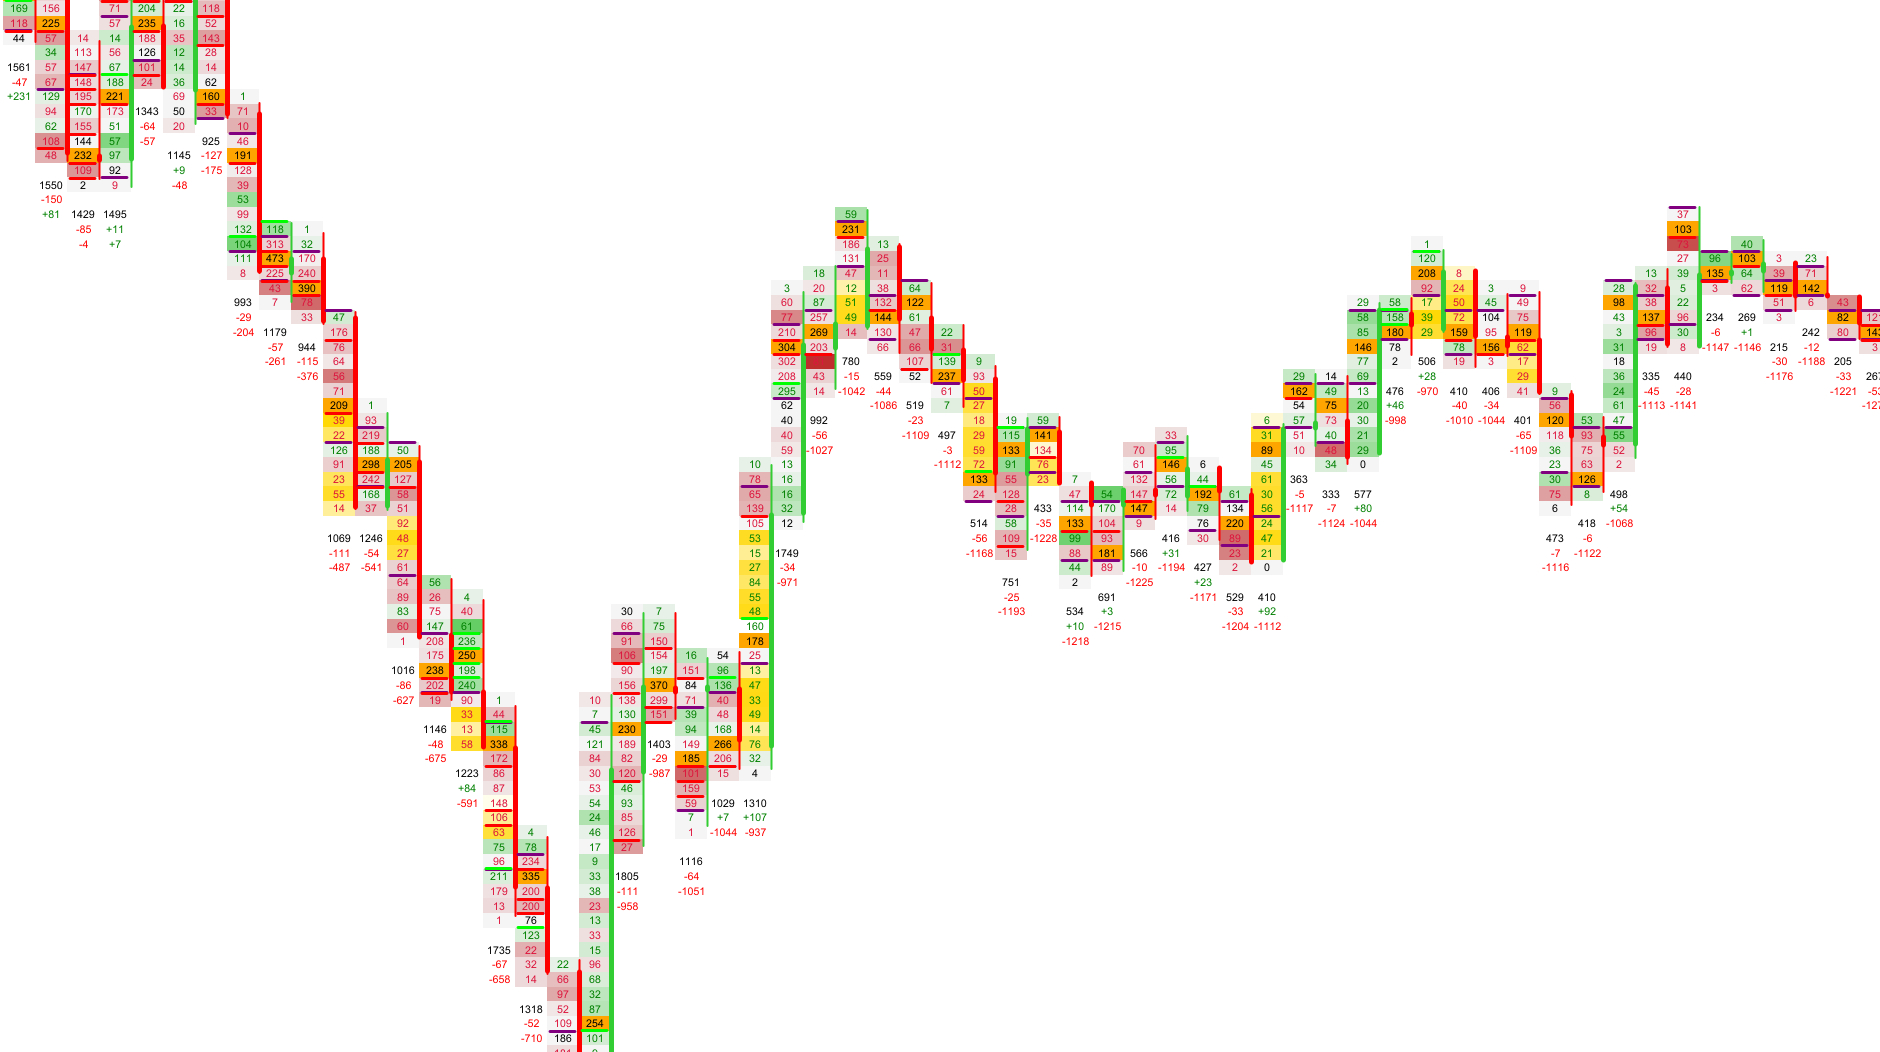
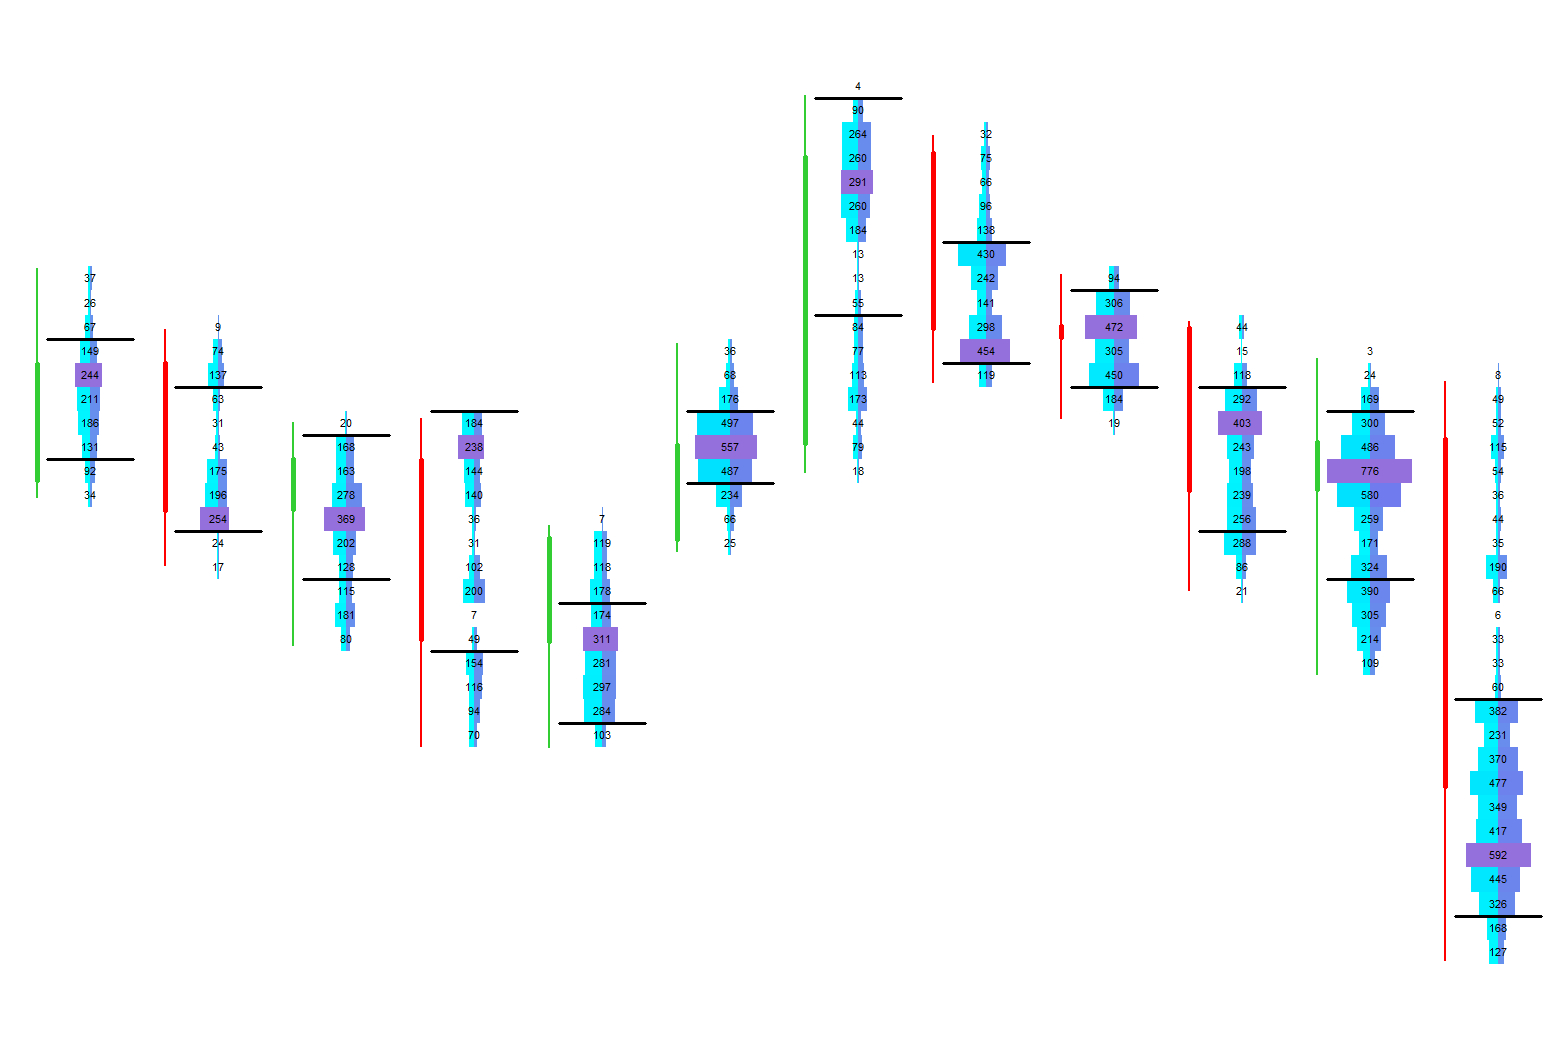
Visual Example: VAH / VAL & POC per Candle
Volume Bars Inside Candles
A clean, intuitive view of intrabar participation.
Instead of footprint text, candles can display volume bars that represent total volume or bid/ask distribution. These bars provide a compact, intuitive view of how aggressively buyers and sellers participated at each price level.
When the Heatmap is enabled, volume bars automatically adopt heatmap colors for seamless visual integration.
Available Modes
| Mode | Description |
|---|---|
| Total Volume Bars | Show the relative size of traded volume at each price level. |
| Bid × Ask Bars | Split each bar into bid‑ and ask‑initiated volume for clearer orderflow insight. |
| Heatmap Integration | Volume bars automatically adopt heatmap colors when enabled. |
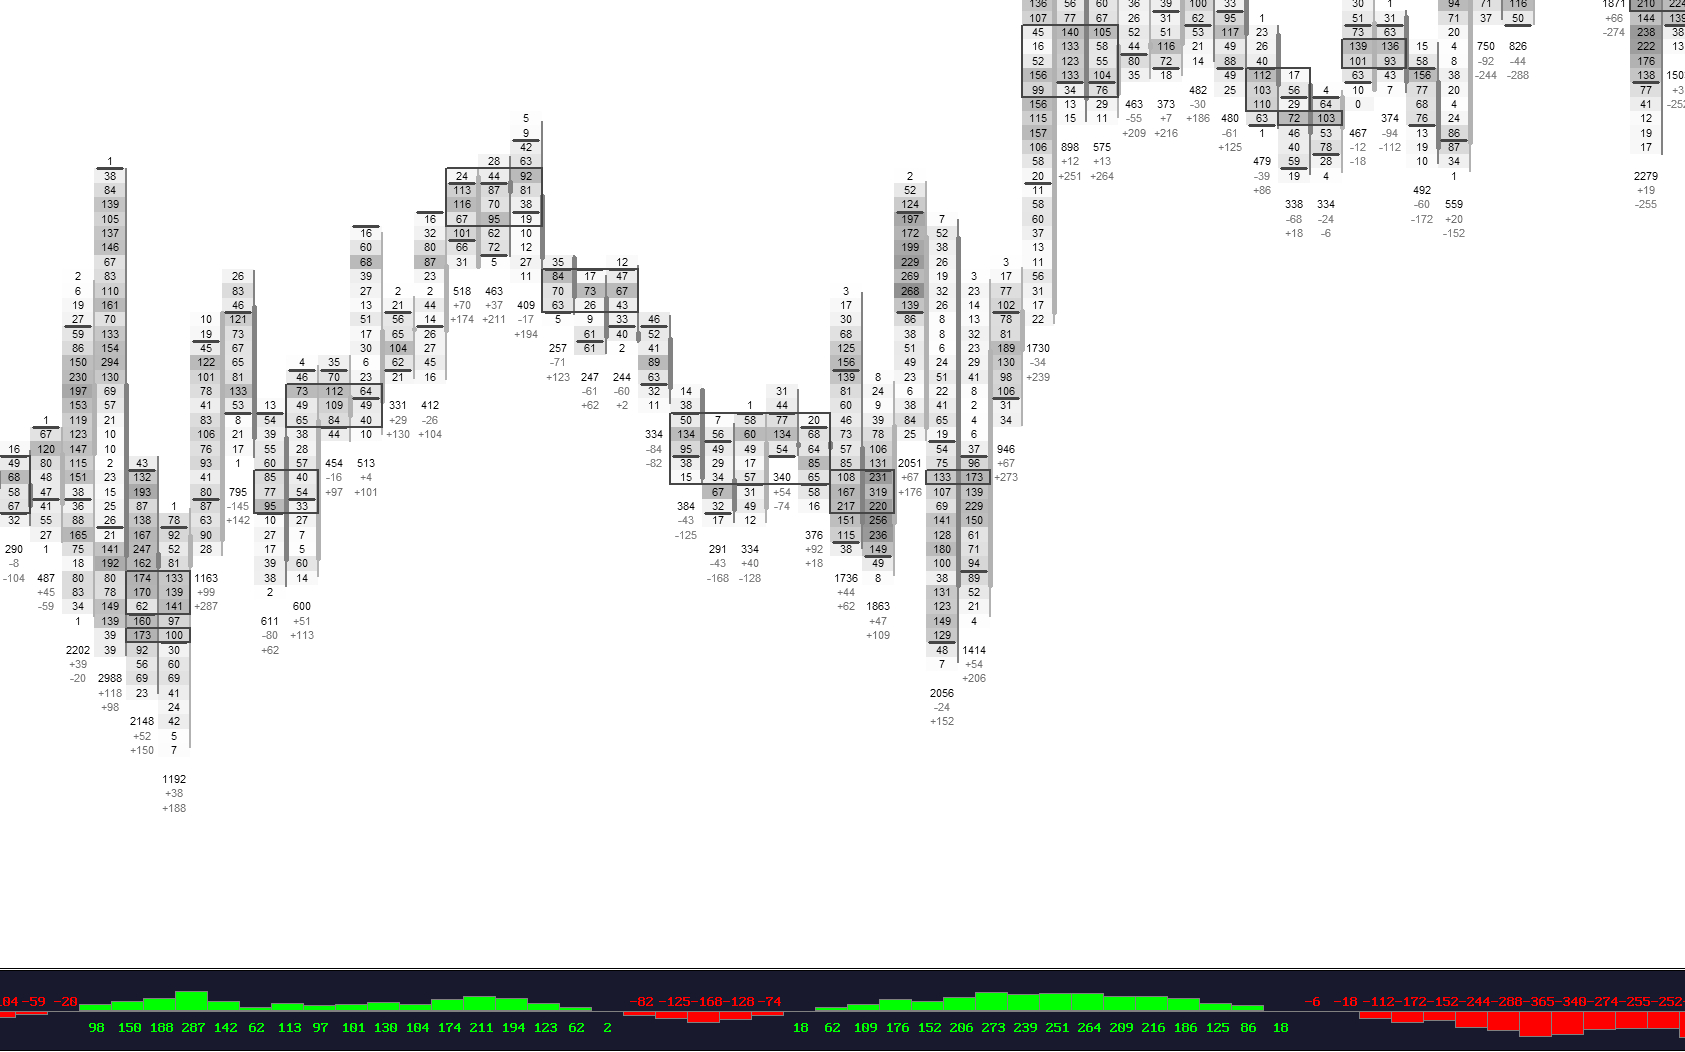
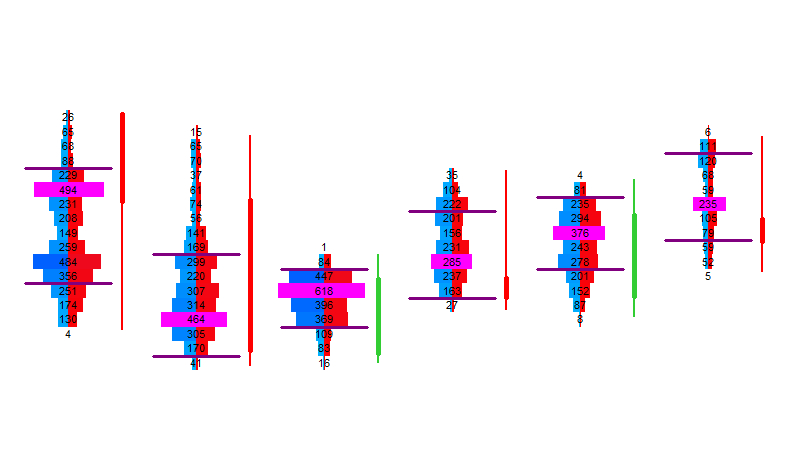
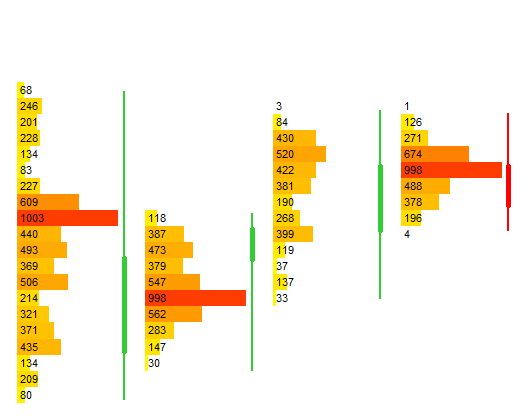
Visual Example: Volume Bars
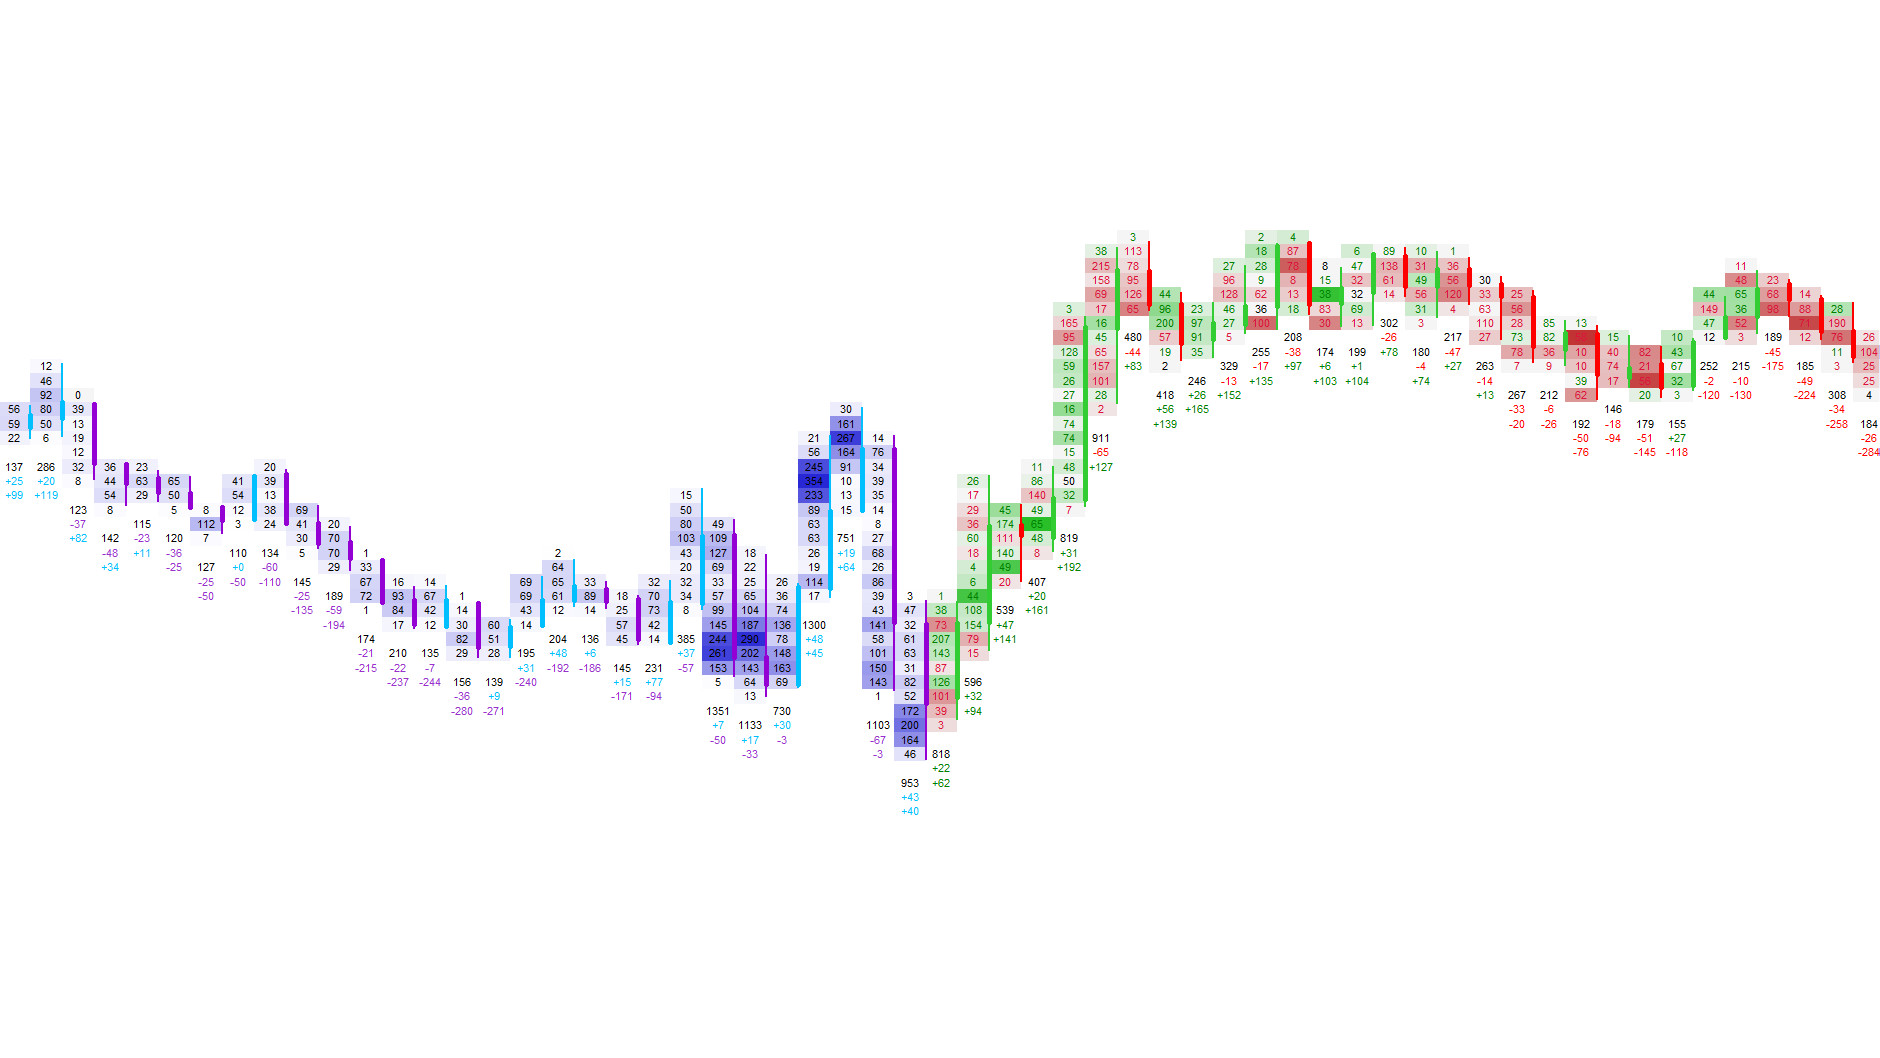
Candle Summary
A compact panel showing volume, delta and cumulative delta per candle.
The candle summary adds a small information row below each candle, showing total traded volume, net delta and cumulative delta up to that candle. All values are derived from the same price‑level grid that powers the footprint, ensuring perfect consistency.
Positive and negative values can be color‑coded separately, making it easy to scan for shifts in participation, absorption or trend strength without additional indicators.
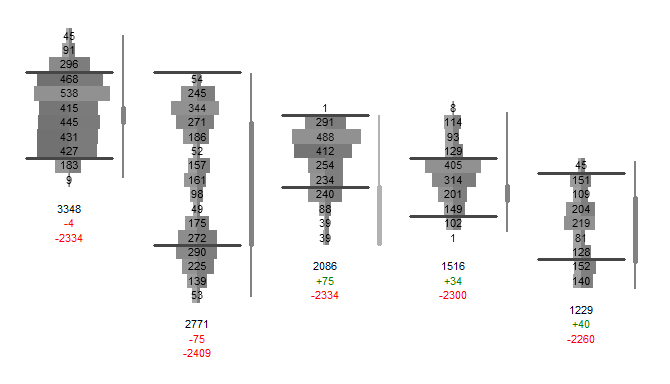
Visual Example: Candle Summary
Next Chapters
Continue exploring the core modules of Footprint‑Secrets.