Footprint Basics
Understand how footprint candles are built – from raw ticks to price-by-price volume.
The footprint is the core of Footprint‑Secrets. It shows how much volume traded at each price level, how that volume was distributed between Bid and Ask, and how aggressive or passive the market behaved inside each candle.
Footprint‑Secrets transforms every candle into a detailed map of traded volume and orderflow behavior. Instead of guessing what happened inside a bar, you see exactly how buyers and sellers interacted at each price level.
Whether you trade reversals, breakouts, rotations or absorption, footprint candles give you the clarity and precision needed to understand the market’s internal structure in real time.
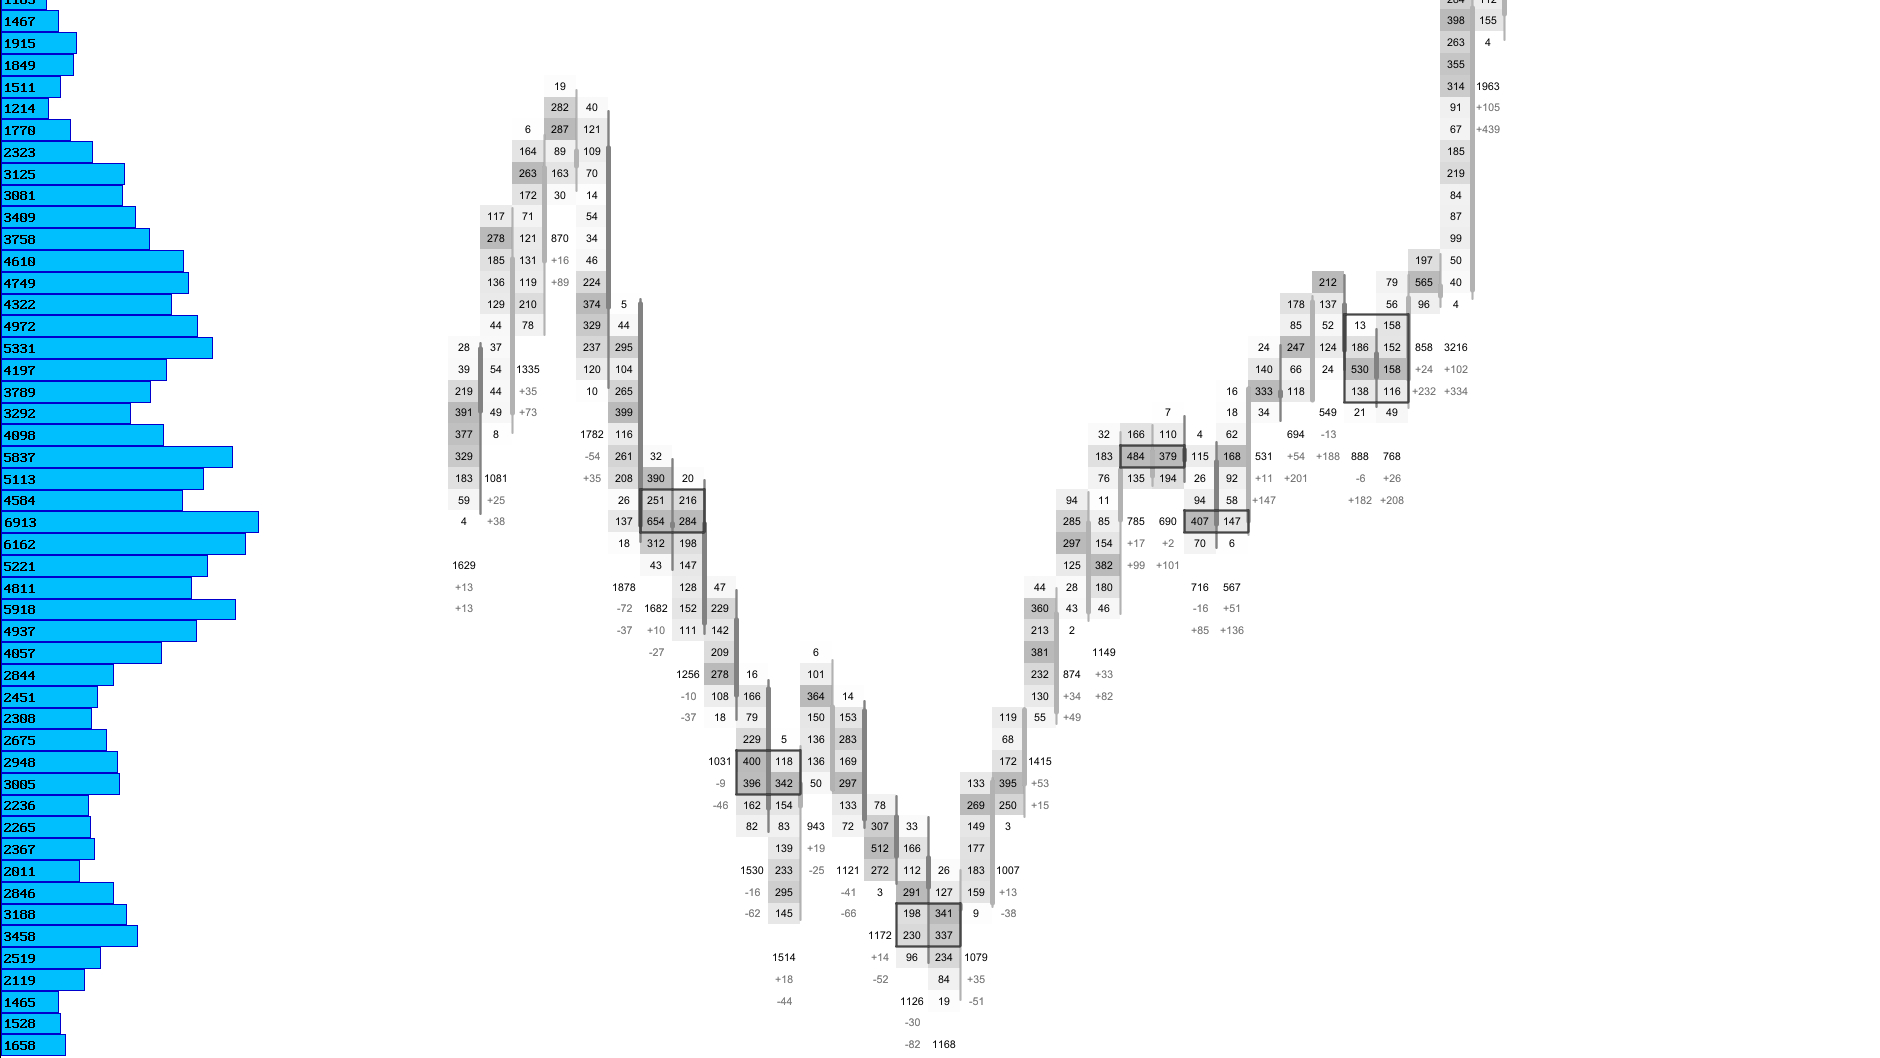
Volume Bars
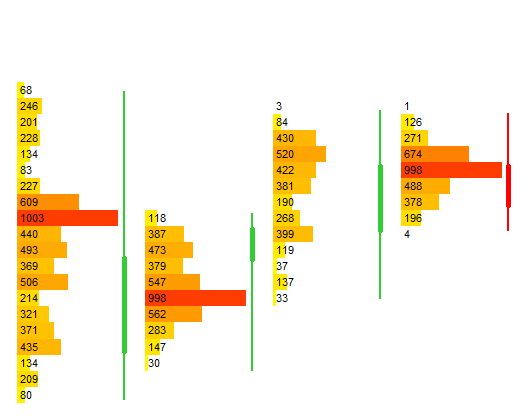
Horizontal bars showing how much volume traded at each price level inside the candle.
Footprint candles can display volume bars at every price level, showing how much activity occurred inside the candle. Longer bars indicate higher participation, while shorter bars highlight areas where the market showed little interest.
Because the bars are built from real tick data, they reflect true market activity rather than synthetic averages. This makes them a powerful tool for identifying balance zones, rejection areas and price levels where liquidity concentrated.
Available Modes
| Mode | Description |
|---|---|
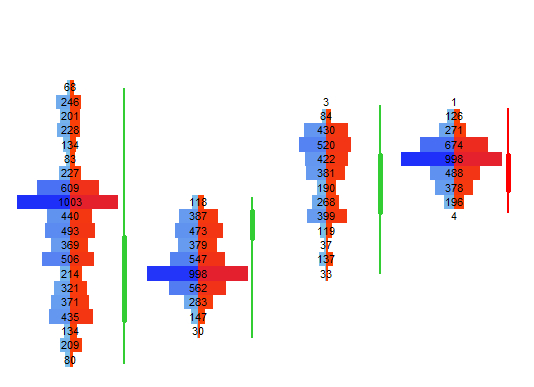
| Total Volume Bars | Show the relative size of traded volume at each price level. |
| Bid × Ask Bars | Split each bar into bid‑ and ask‑initiated volume for clearer orderflow insight. |
Visual Example: Volume Bars
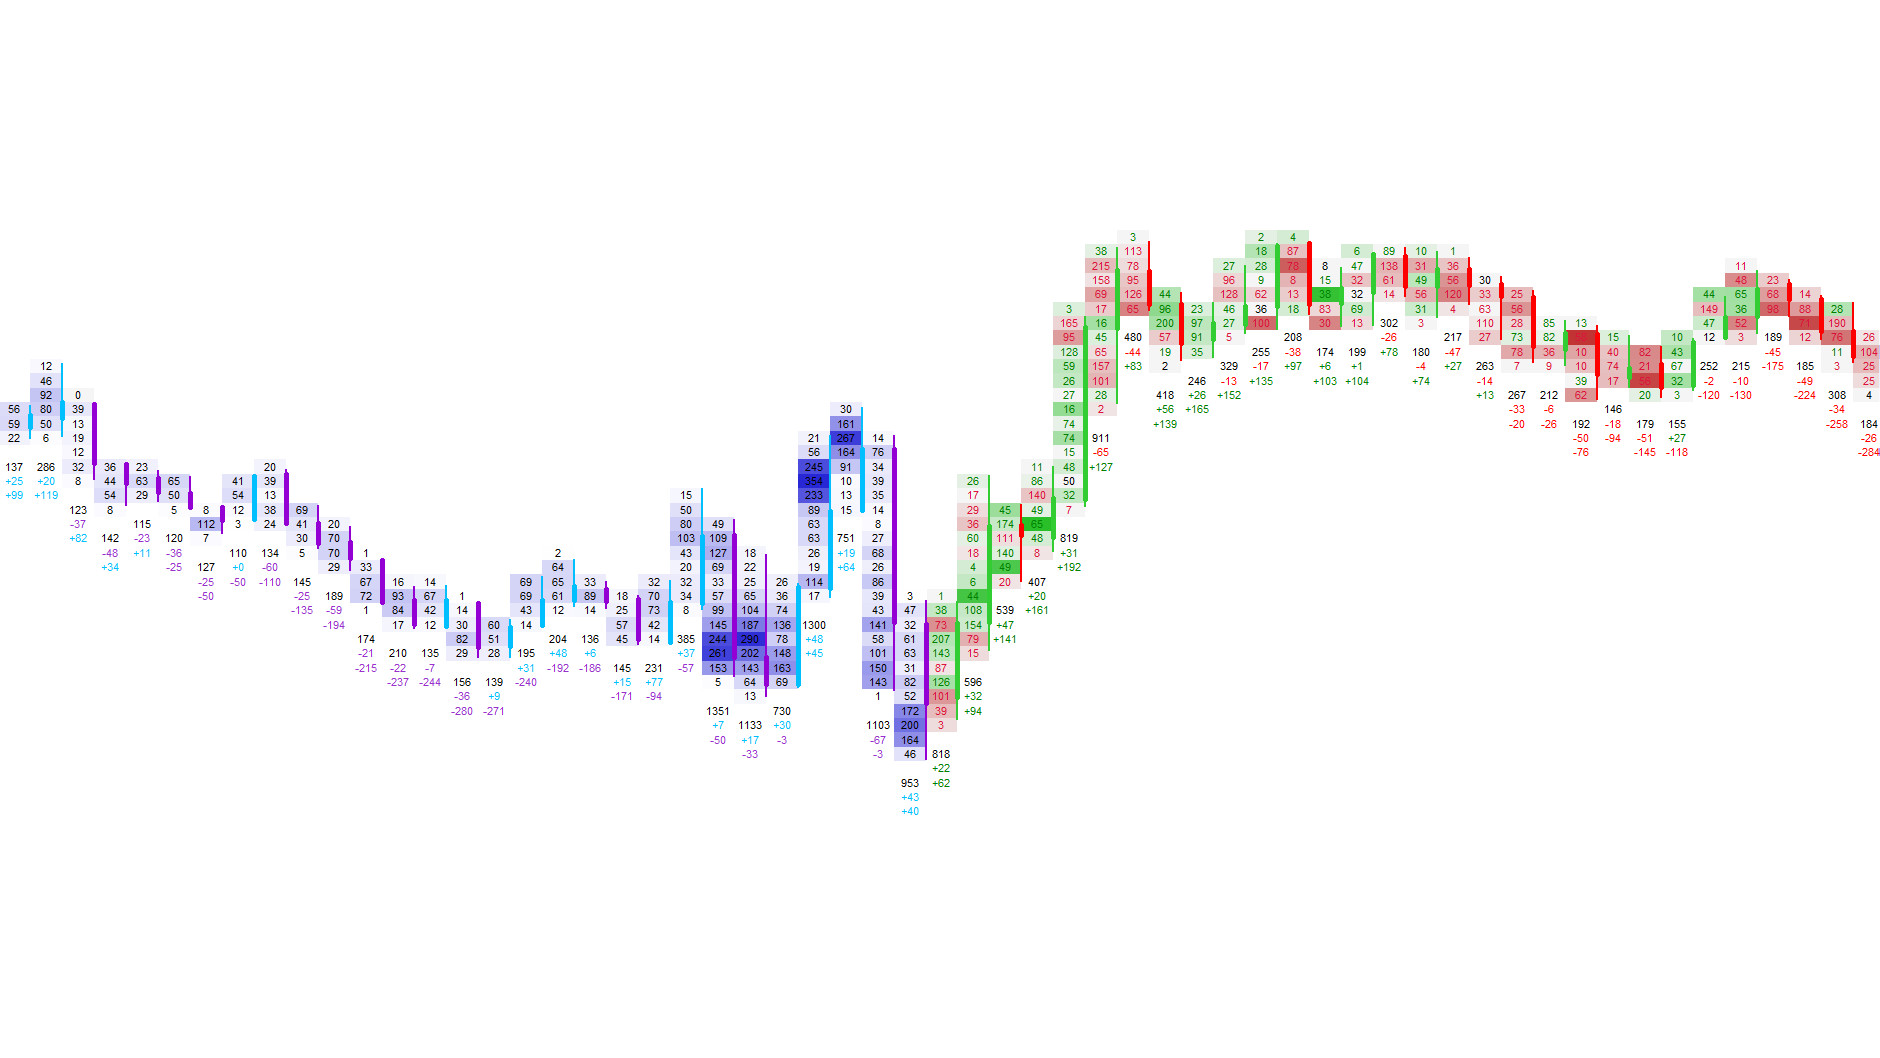
Footprint Text Modes
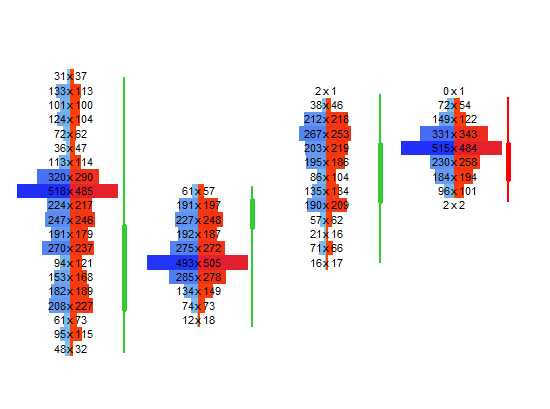
Choose what information is printed at each price level.
Footprint text modes define what you see at every price level inside the candle. You can focus on raw traded volume, directional imbalance or normalized percentages for cleaner comparisons.
Bid × Ask shows aggressive buying vs. selling, Delta highlights which side dominated the auction, Total Volume shows how much traded at each level, and percentage modes normalize values for clearer comparisons.
Available Modes
| Mode | Description |
|---|---|
| Bid × Ask | Shows aggressive buying vs. selling at each price. |
| Delta | Highlights which side dominated the auction. |
| Total Volume | Shows how much traded at each level. |
| Percentage Modes | Normalize values for cleaner comparisons. |
Visual Example: Bid × Ask Text
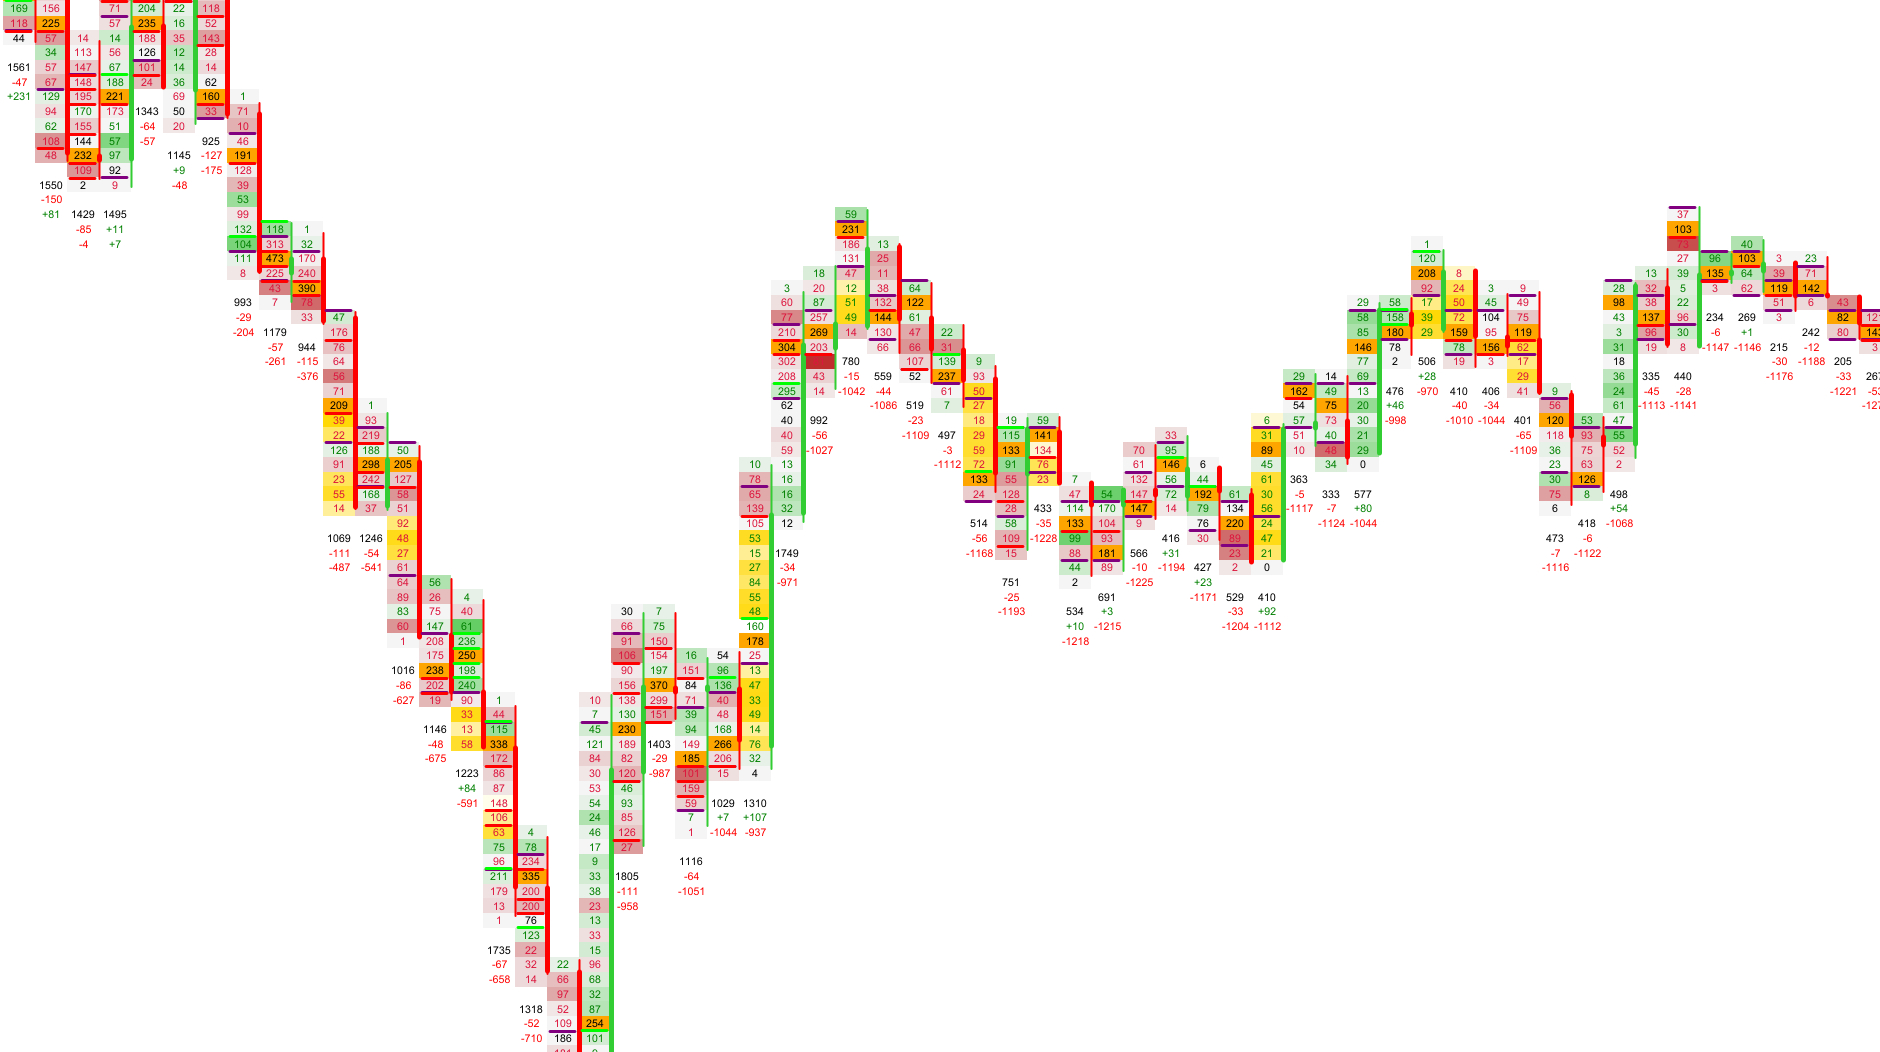
Heatmap
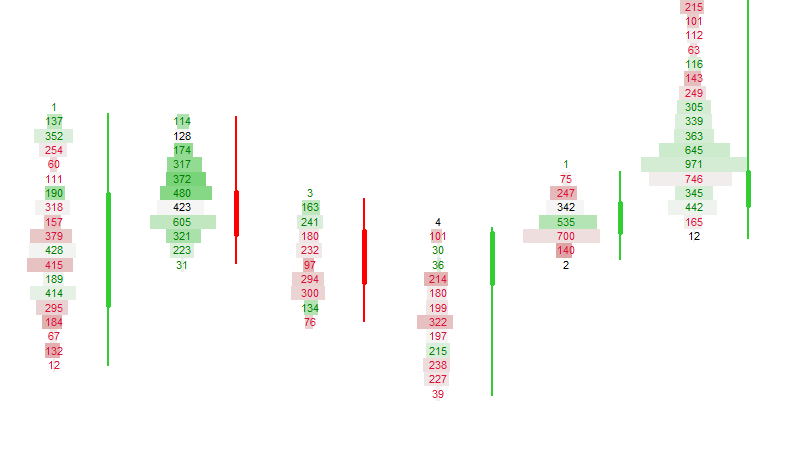
Highlight volume and delta intensity inside each candle.
The heatmap overlay adds an extra layer of context to each footprint candle. High‑volume or strong‑imbalance price levels are highlighted, making it easier to spot absorption, exhaustion and aggressive initiative flows.
You can choose between volume‑based and delta‑based heatmaps, and fine‑tune the color ranges to match your preferred visual intensity and background.
Available Modes
| Mode | Description |
|---|---|
| Volume Heatmap | Shows where the market traded heavily. |
| Delta Heatmap | Highlights aggressive buying or selling. |
Visual Example: Heatmap
Next Chapters
Continue exploring the core modules of Footprint‑Secrets.