Control Panel
A streamlined interface for managing footprint modes, heatmap overlays, analytical layers, custom candles, trading actions and session tools — all in one place.
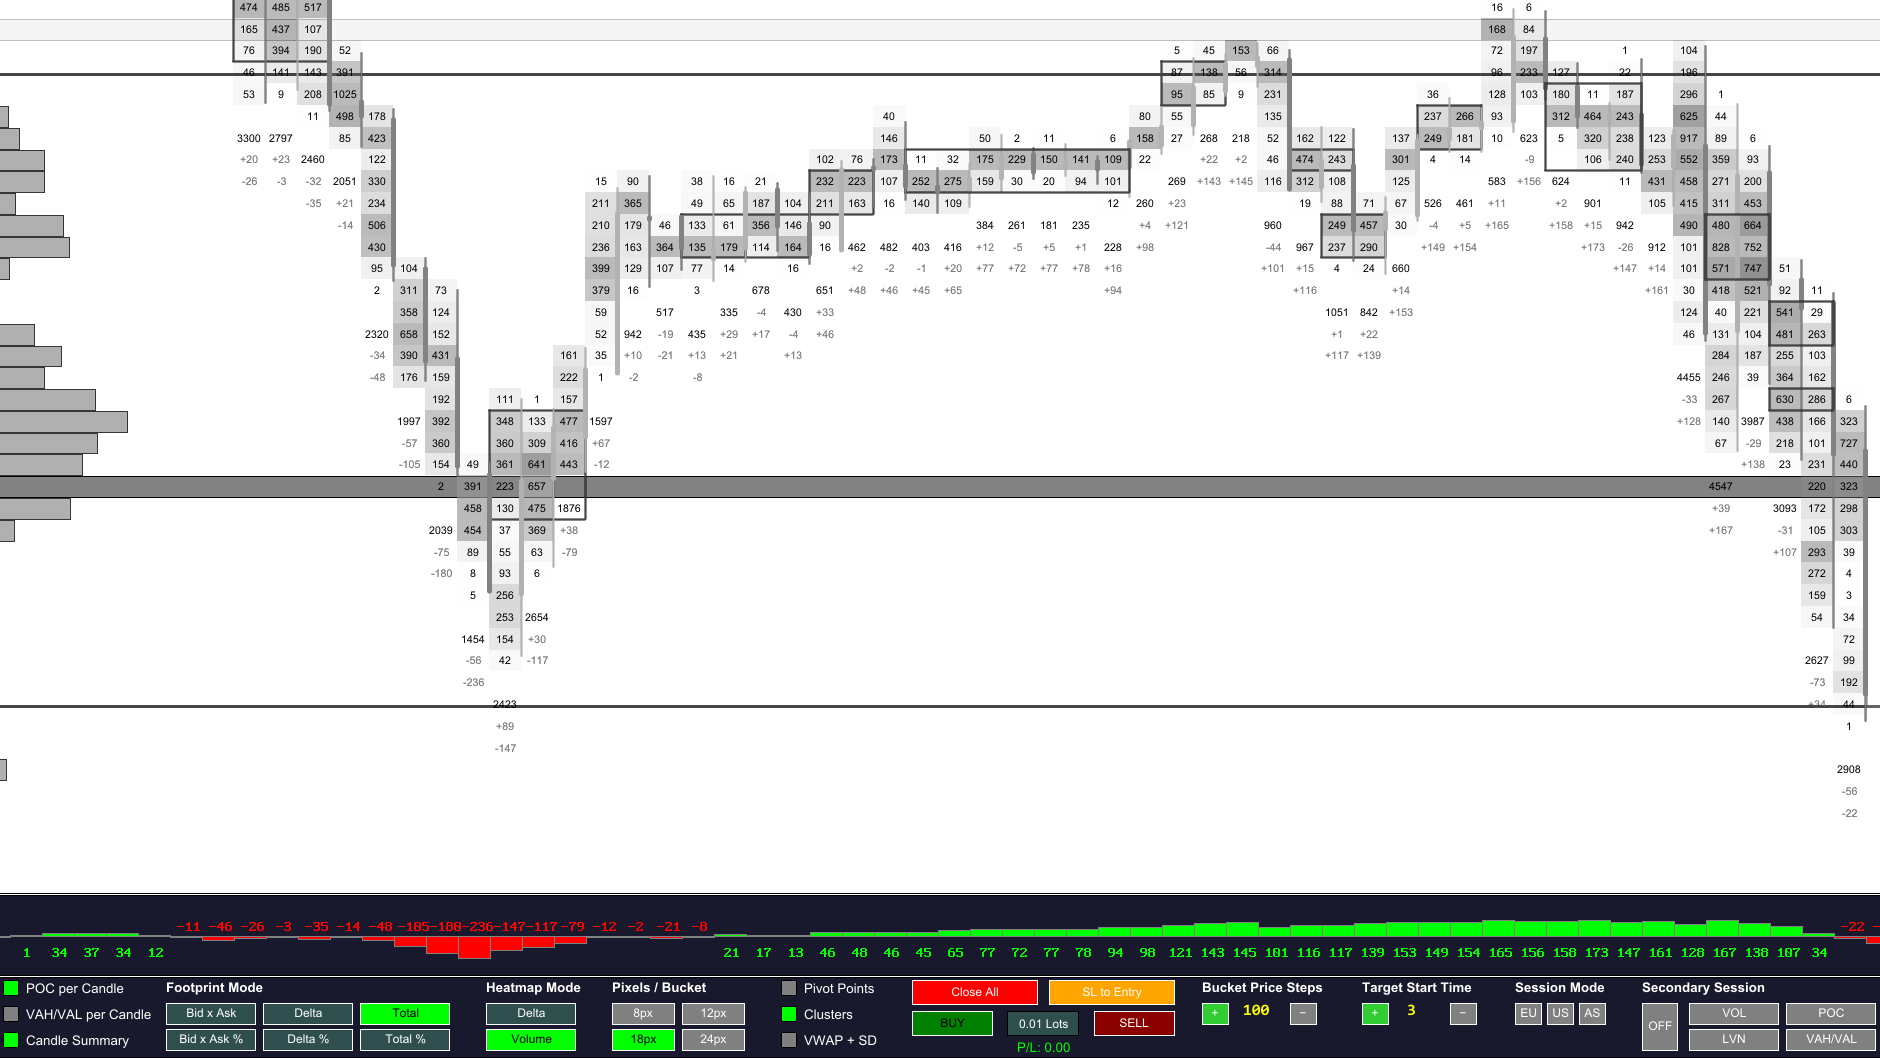
The Control Panel is the command center of Footprint‑Secrets. It brings all essential footprint, heatmap, session and trading controls into a single, compact interface. Designed for speed and clarity, it allows you to adjust visualization modes, enable analytical layers, switch candle logic and execute trading actions without leaving the chart.
Every element is optimized for fast decision‑making: clear labels, consistent spacing and intuitive grouping ensure that the panel remains unobtrusive while providing full control over your trading environment.
Market Structure Tools
Visual layers that reveal aggression, absorption, imbalance and structural reference points.
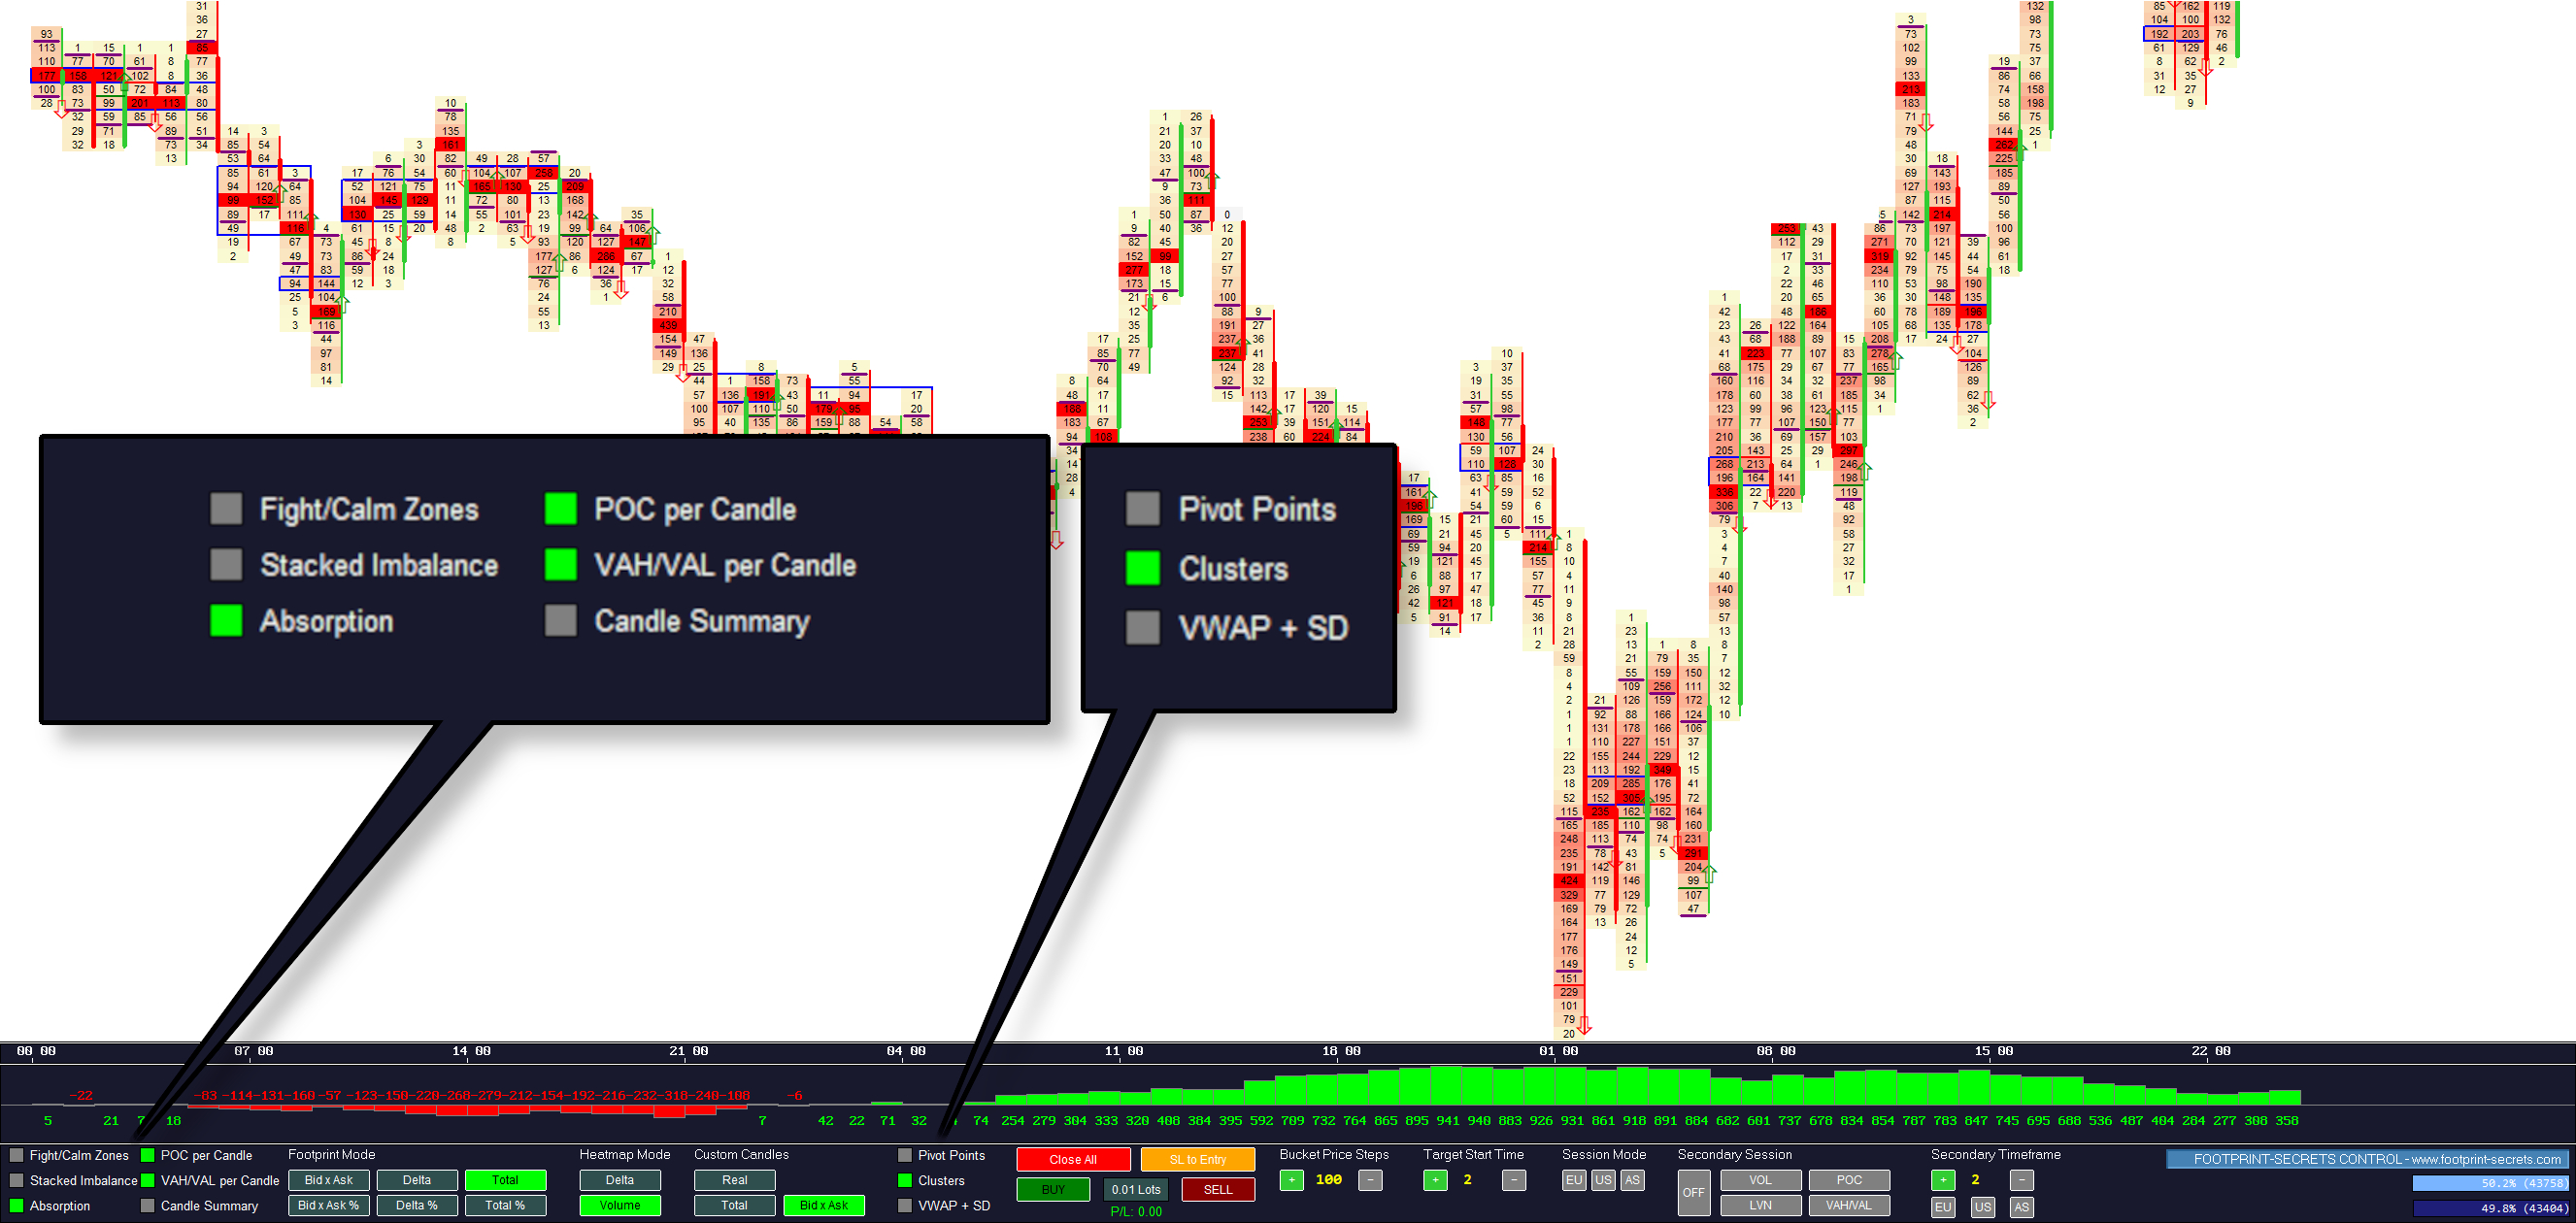
Available Tools
| Tool | Description |
|---|---|
| Fight / Calm Zones | Highlights aggressive vs. passive trading areas. |
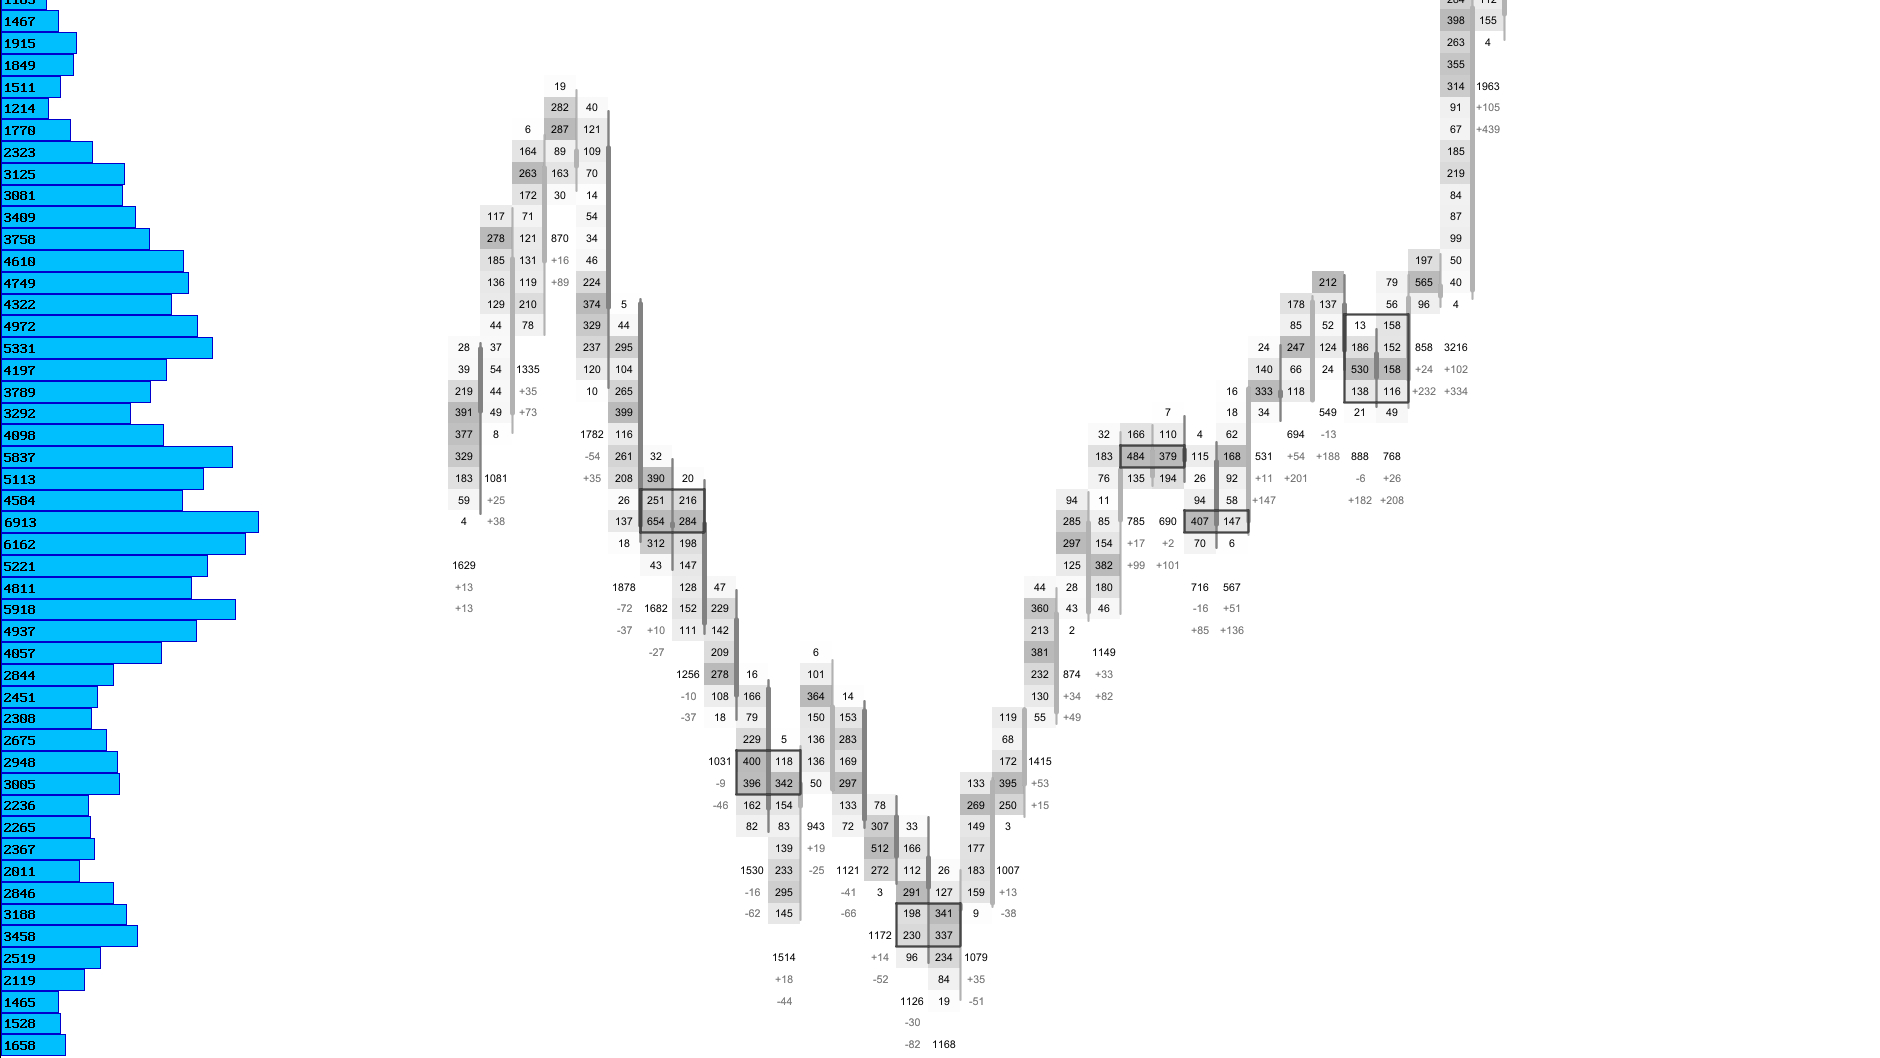
| POC per Candle | Shows the strongest traded price inside each candle. |
| Stacked Imbalance | Reveals multi‑level bid/ask dominance. |
| VAH / VAL per Candle | Displays micro value areas inside each candle. |
| Absorption | Detects hidden limit orders absorbing market orders. |
| Candle Summary | Shows total volume, delta and imbalance per candle. |
| Pivot Points | Classic intraday support and resistance levels. |
| Clusters | Highlights liquidity clusters and absorption pockets. |
| VWAP + SD | Displays VWAP and its standard deviation bands. |
Footprint & Heatmap Modes
Switch between footprint text modes, custom candles and heatmap overlays.
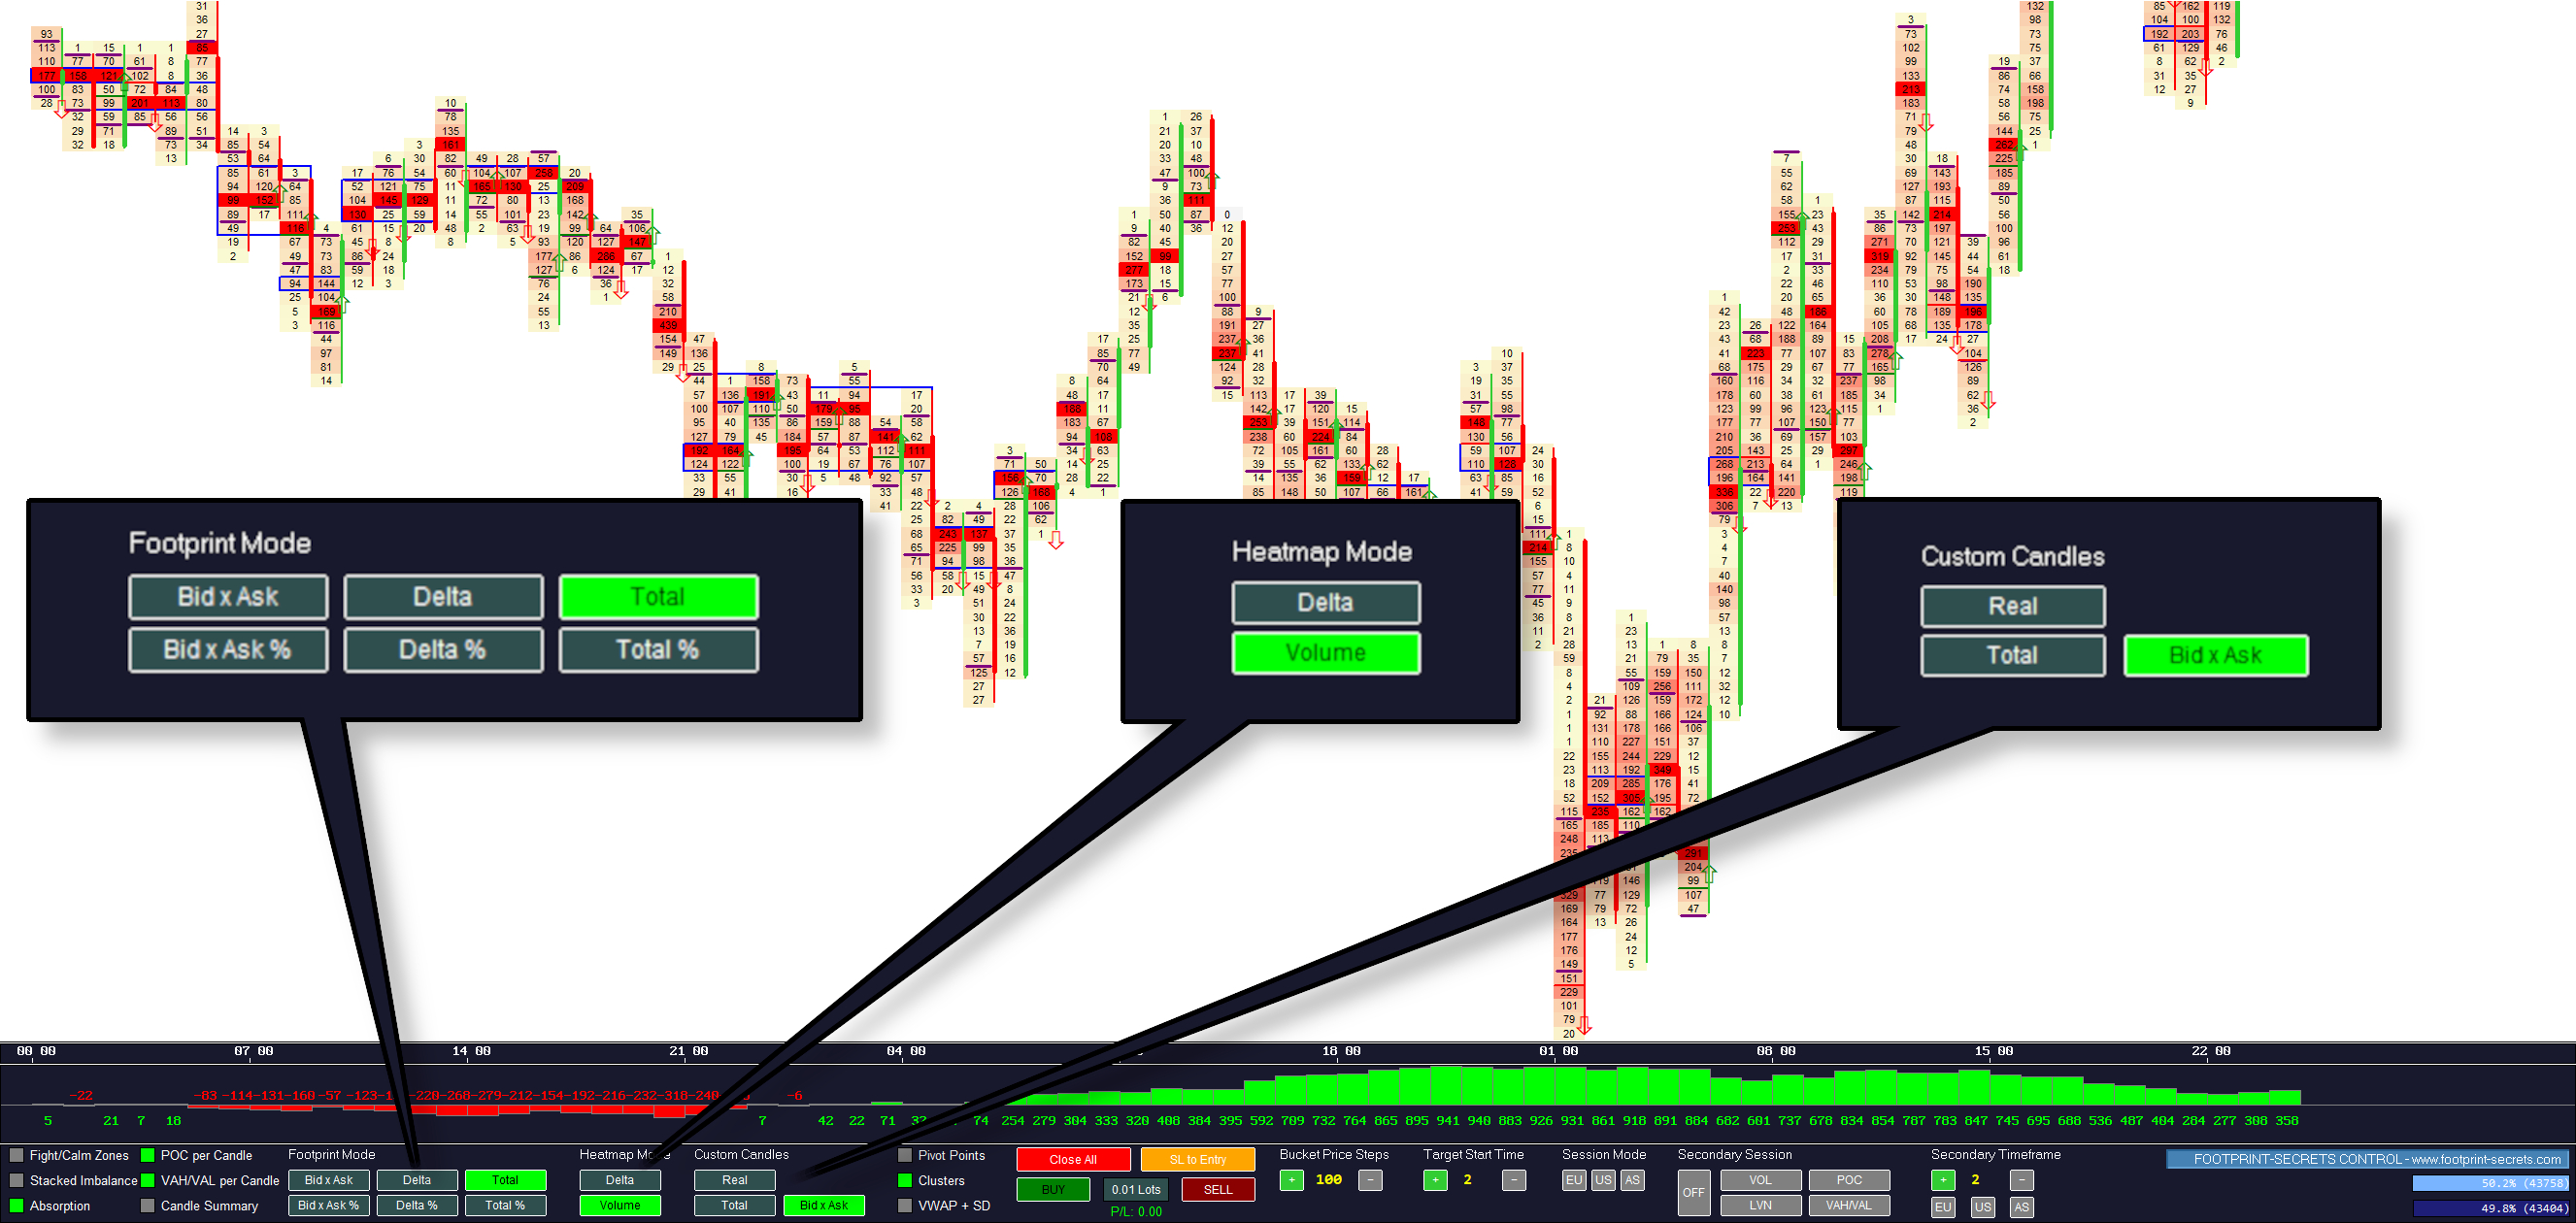
Footprint Modes
| Mode | Description |
|---|---|
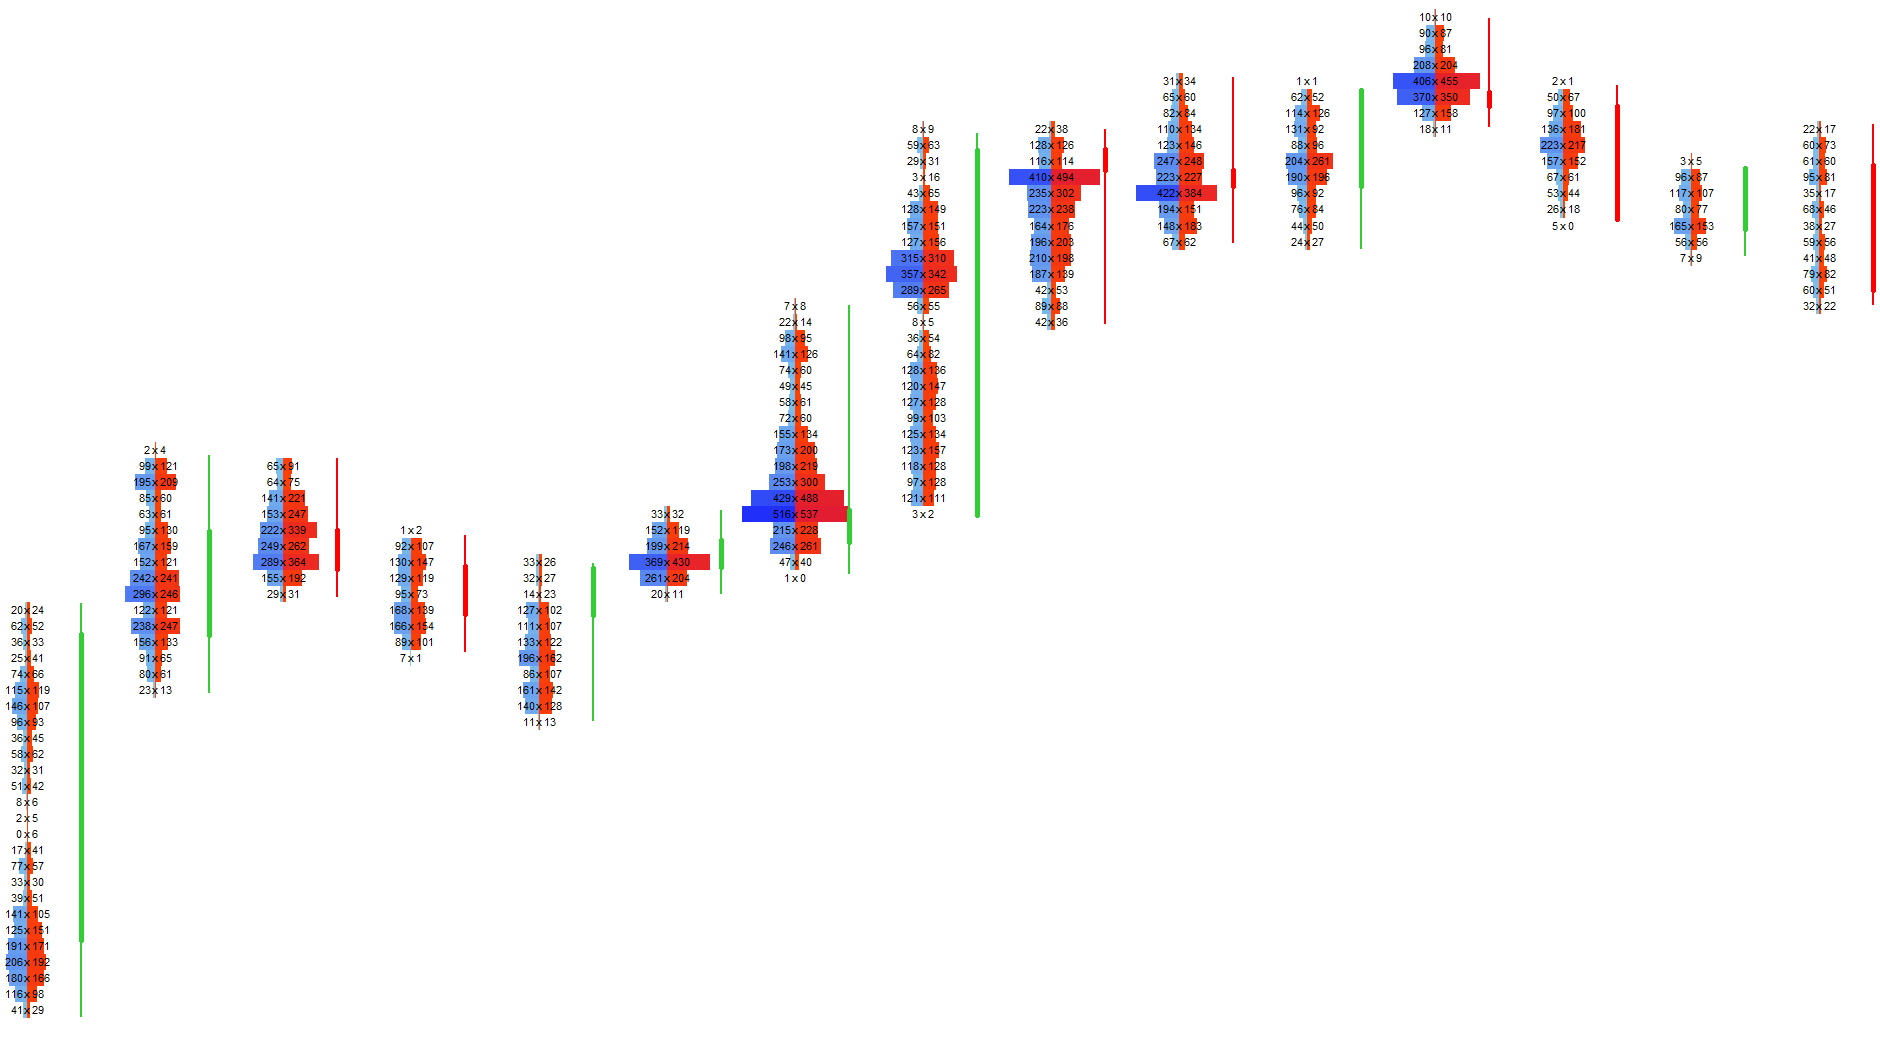
| Bid × Ask | Shows bid and ask volume at each price level. |
| Delta | Displays aggressive buying vs. selling. |
| Total | Shows total traded volume per price level. |
| Bid × Ask % | Shows bid/ask distribution in percent. |
| Delta % | Shows delta intensity in percent. |
| Total % | Shows total volume relative to candle maximum. |
Heatmap Modes
| Mode | Description |
|---|---|
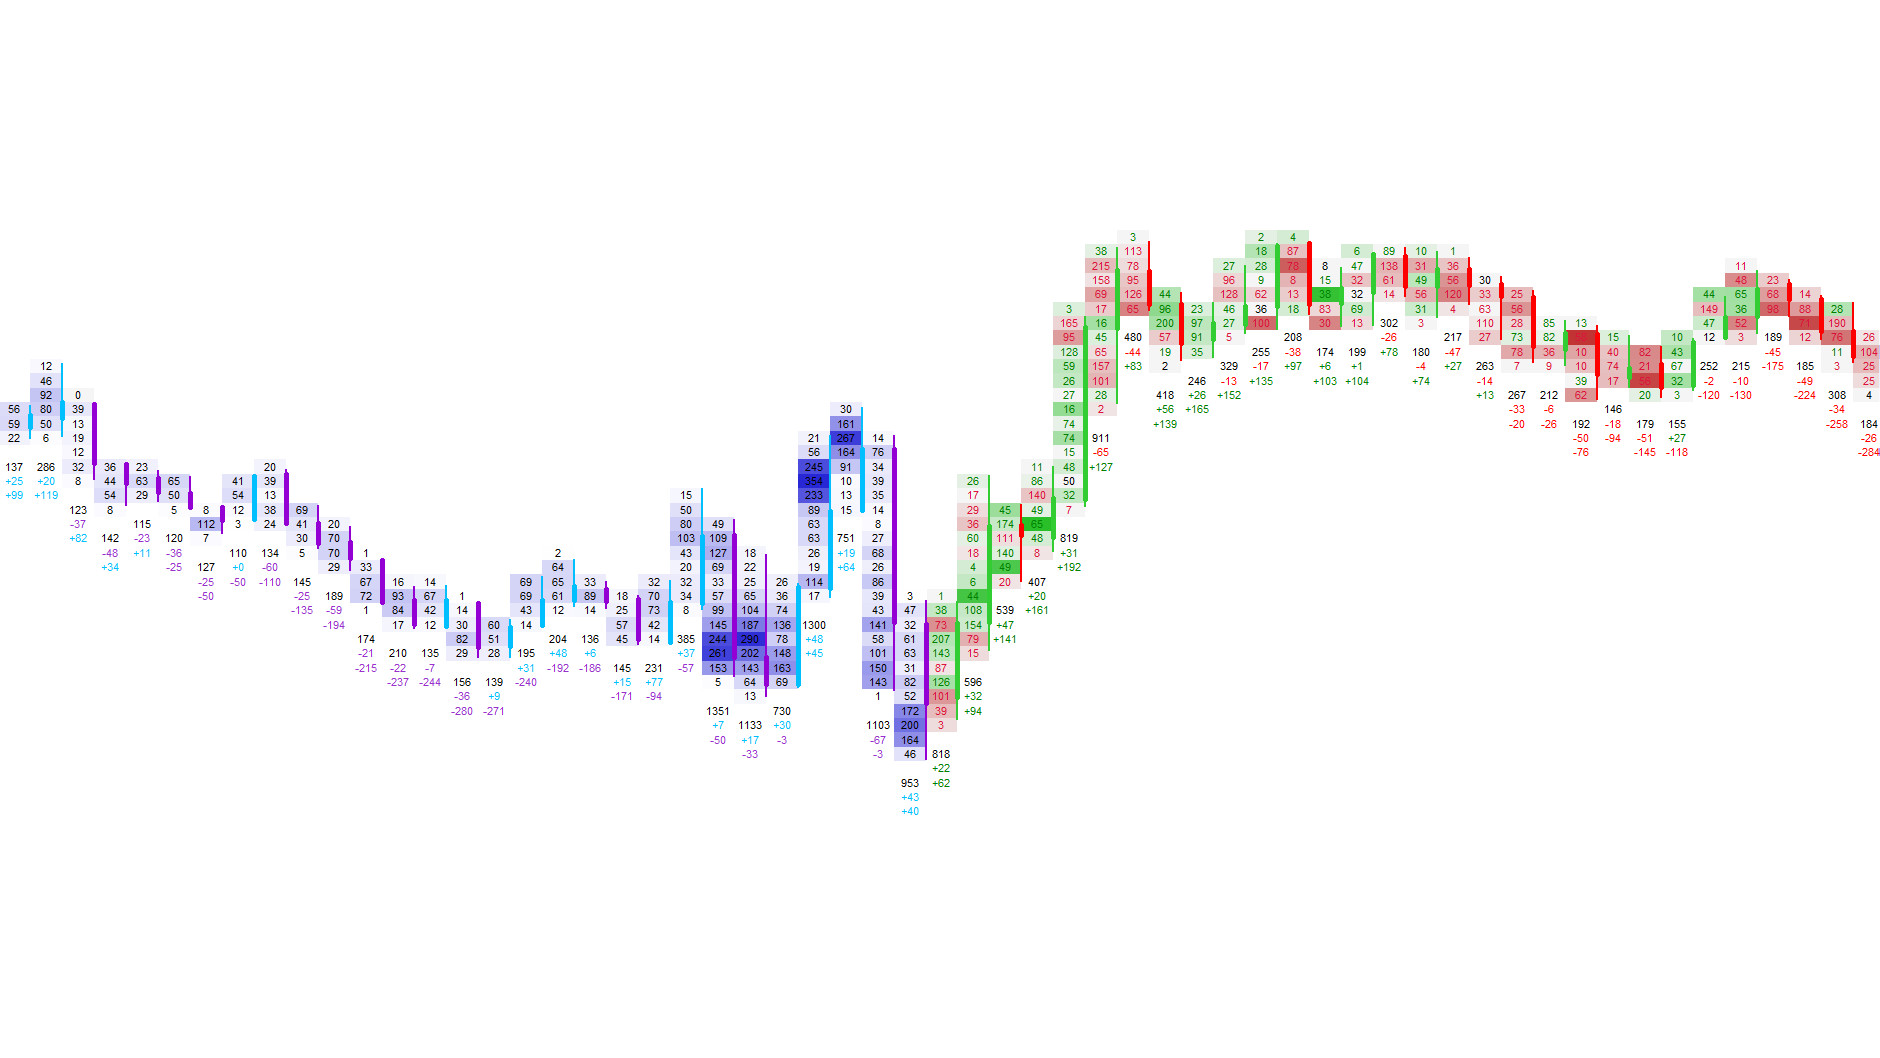
| Delta Heatmap | Highlights strong bid‑ or ask‑side aggression. |
| Volume Heatmap | Shows volume intensity inside each price level. |
Candle & Time Axis Modes
| Mode | Description |
|---|---|
| Custom Candles | Switch between real‑time and custom‑timed candles. |
| Total Volume Bars | Draws a volume bar inside each candle. |
| Bid × Ask Bars | Splits the volume bar into bid‑ and ask‑side components. |
Trading & Sessions
Execute trades, manage stops, adjust price levels and control session‑based analysis.
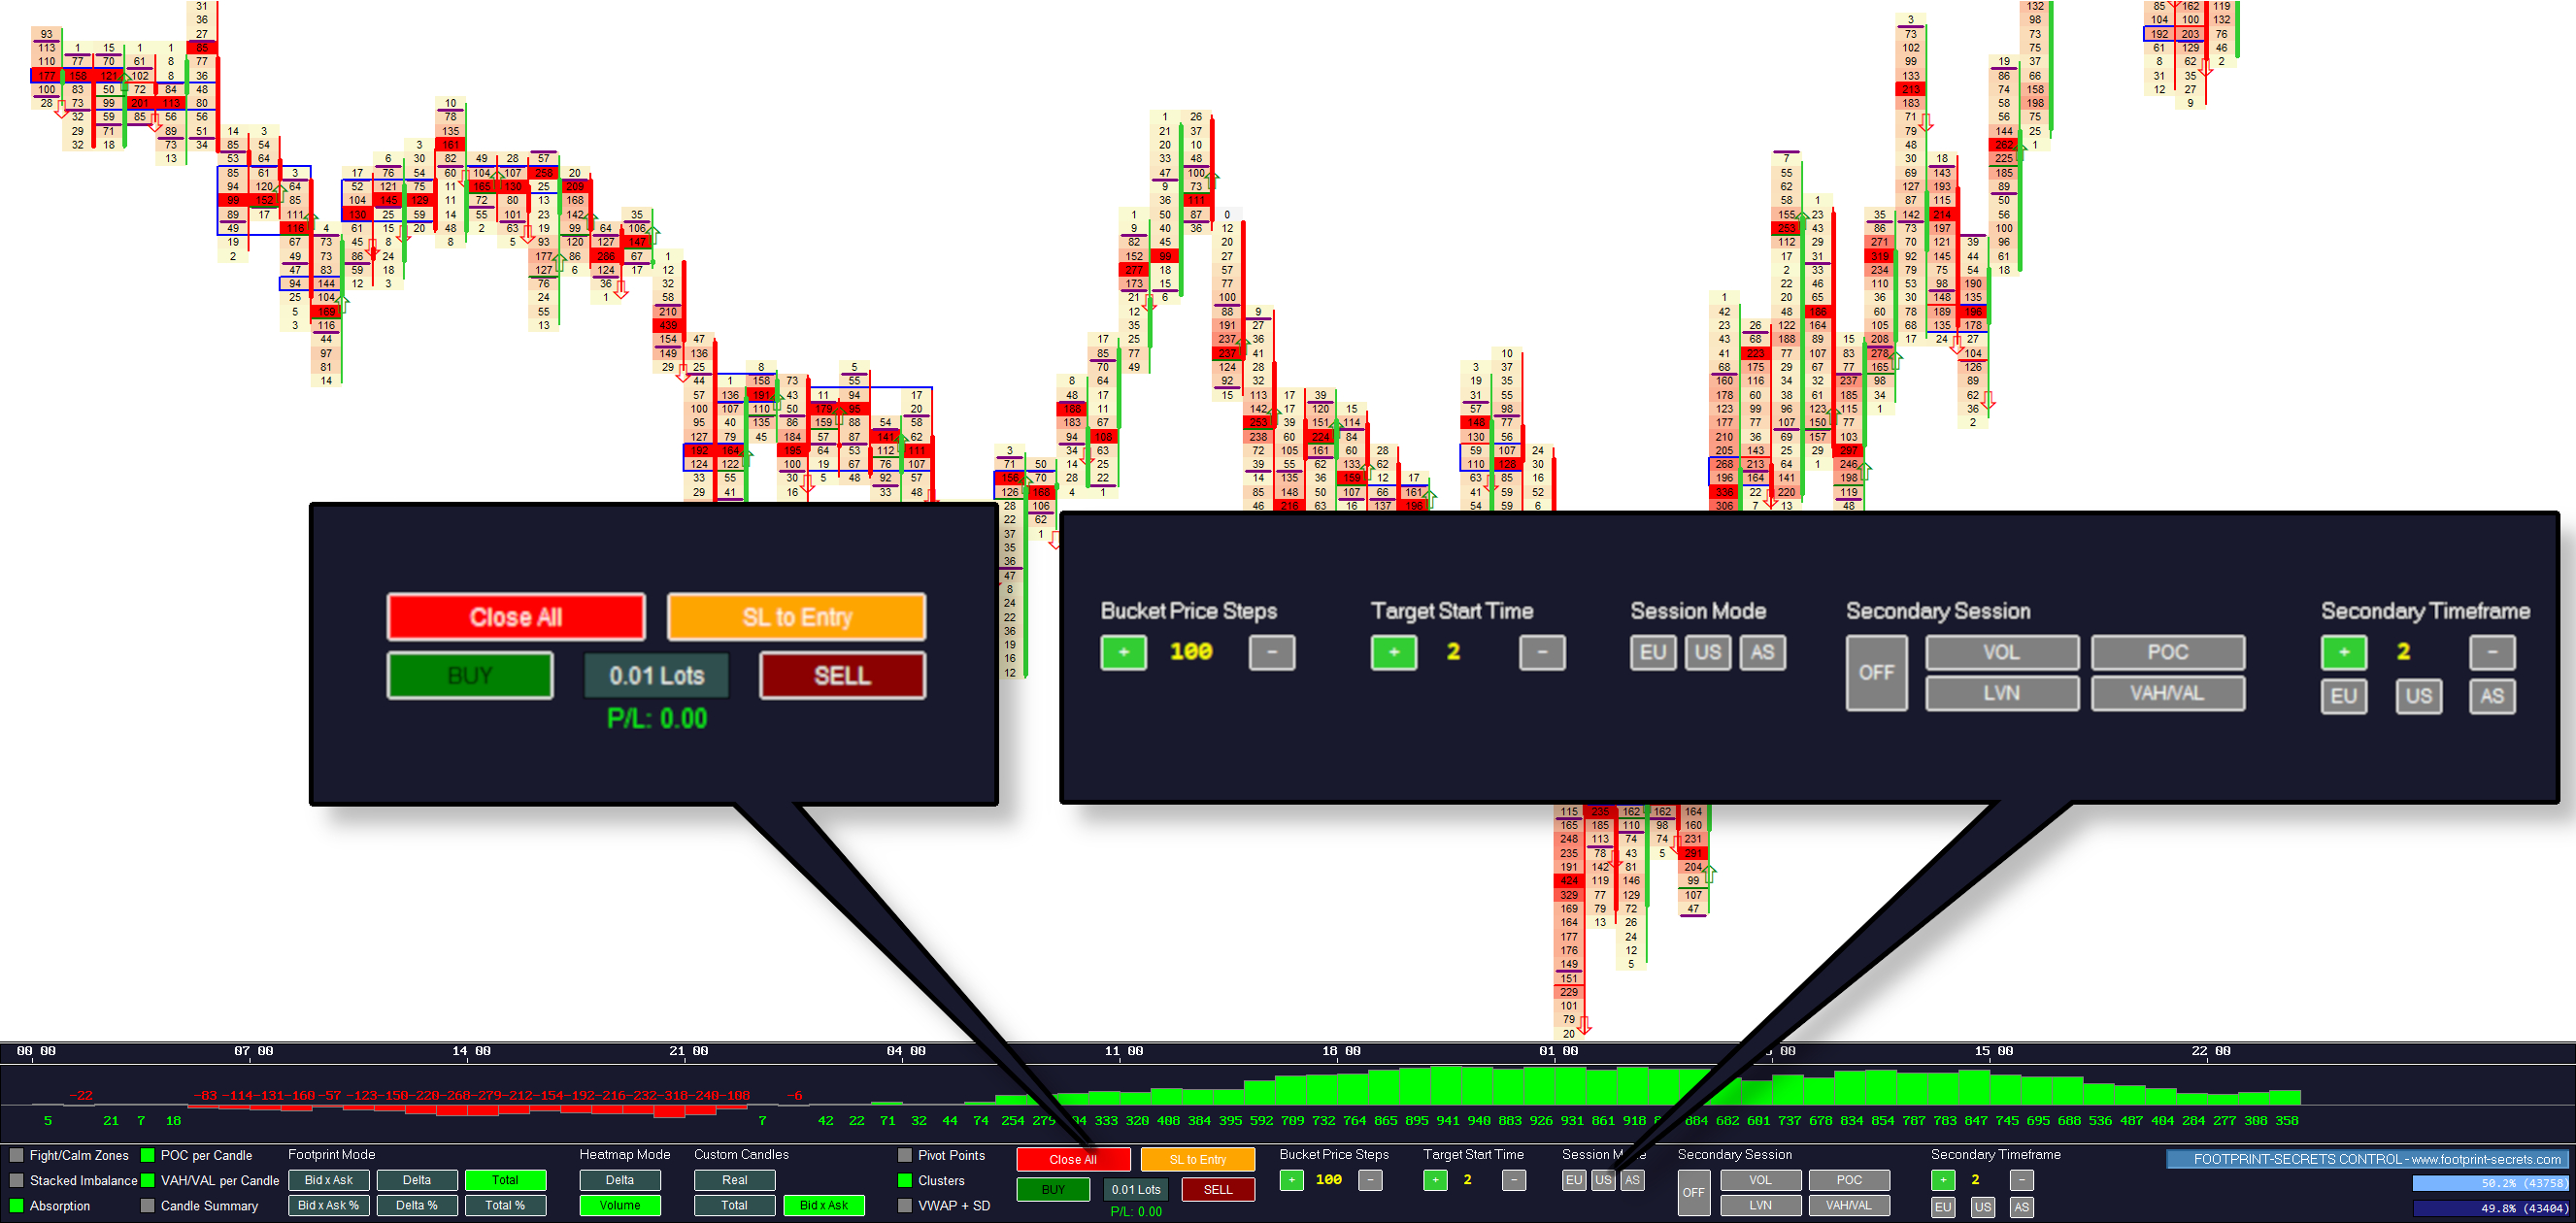
Trading Actions
| Action | Description |
|---|---|
| Close All | Closes all open positions instantly. |
| SL to Entry | Moves the stop loss to breakeven. |
| BUY | Opens a long position. |
| SELL | Opens a short position. |
| Lot Size | Adjusts the trading lot size. |
Price Level Controls
| Control | Description |
|---|---|
| Increase Bucket Size | Expands the vertical footprint cell height. |
| Decrease Bucket Size | Reduces the vertical footprint cell height. |
Session Start Time
| Control | Description |
|---|---|
| Shift Start Time Forward | Moves the session start forward. |
| Shift Start Time Backward | Moves the session start backward. |
Session Modes
| Session | Description |
|---|---|
| EU | Focus on European session dynamics. |
| US | Focus on US session dynamics. |
| AS | Focus on Asian session dynamics. |
Secondary Session Tools
| Tool | Description |
|---|---|
| Secondary Volume | Shows volume distribution of a secondary session. |
| Secondary POC | Highlights the strongest price of a secondary session. |
| Secondary LVN | Shows low‑volume rejection zones of a secondary session. |
| Secondary VAH / VAL | Displays value area high/low of a secondary session. |
Global Bid/Ask Bars
The Global Bid/Ask Bars show how much volume traded on the bid versus the ask across the entire session. They update with every tick and give you a clean sense of whether buyers or sellers dominate the auction.
The bars display both percentage and absolute volume, helping you understand the underlying pressure behind each move.
Next Chapters
Continue exploring the core modules of Footprint‑Secrets.