Cluster Detection
High‑volume zones that reveal hidden liquidity, absorption and structural pressure.
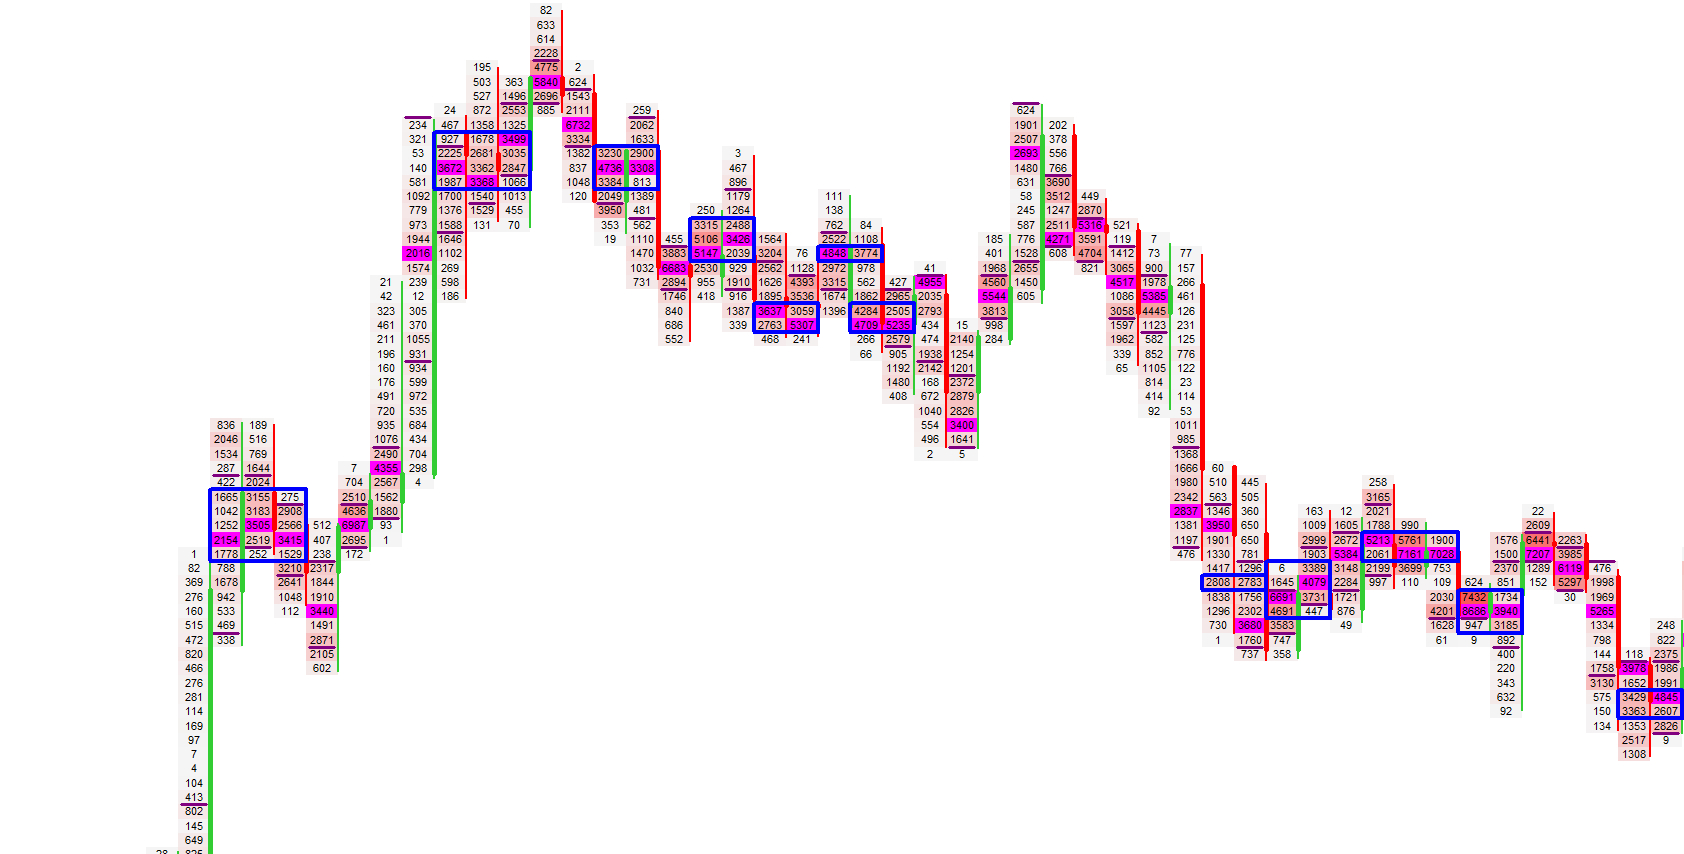
Cluster Detection highlights price zones where trading activity concentrated across multiple candles. Instead of focusing on isolated prints, clusters reveal where the market repeatedly traded size in a tight price band — potential absorption, acceptance or strong interest from larger participants.
The detection engine scans the footprint grid for connected areas of elevated activity and draws clean, structural zones around them. This gives you a precise map of where the market truly cared about price, not just where it briefly traded.
What Cluster Detection Highlights
Structural pressure zones that shape market behavior.
Clusters reveal where the market repeatedly interacted with size — areas that often act as magnets, barriers or pivot zones. These regions frequently align with absorption, hidden liquidity, trapped traders or defended price levels.
By isolating where real work was done, clusters provide a structural map that helps anticipate breakouts, reversals and continuation moves.
Key Concepts
| Concept | Description |
|---|---|
| Absorption Zones | Areas where aggressive orderflow is repeatedly absorbed instead of breaking through. |
| Hidden Liquidity | Price regions that consistently attract volume without obvious visual cues. |
| Trapped Traders | Failed rotations or breaks that leave participants stuck on the wrong side. |
| Aggressive Sweeps | Fast, high‑volume pushes that leave a structural footprint in the tape. |
| Defended Zones | Levels protected across multiple candles and price steps. |
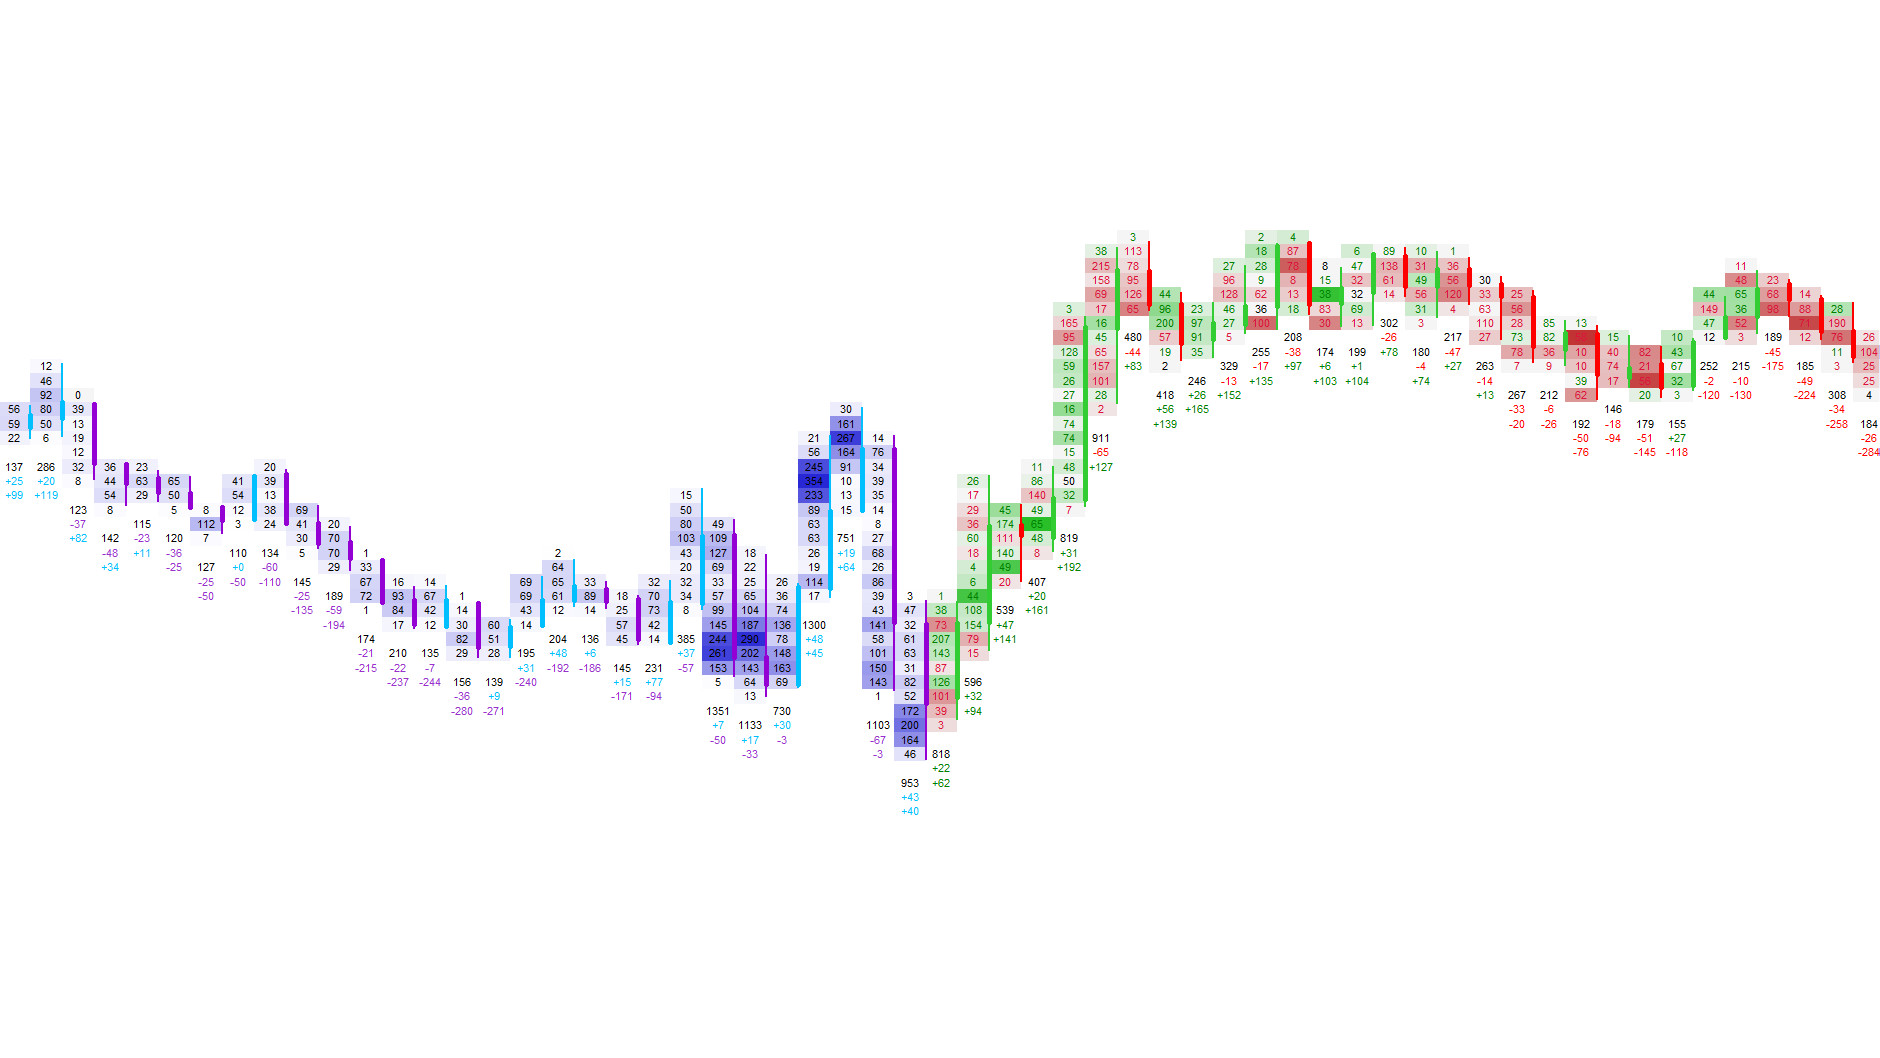
How Clusters Are Identified
A dynamic, multi‑factor scan of the footprint grid.
Each footprint cell is evaluated against dynamic thresholds derived from average traded volume, total candle volume and the strongest price level within the candle. Cells that exceed these thresholds are marked as active.
Adjacent active cells — across both price and time — are grouped into connected components. Only components that span a minimum number of candles and price steps are promoted to full cluster zones, filtering out noise and highlighting meaningful structure.
This adaptive approach ensures clusters remain relevant in both quiet and high‑volatility sessions.
Detection Modes
| Mode | Description |
|---|---|
| Activity Threshold | Defines how much volume a cell must show to be considered active. |
| Cluster Duration | Minimum number of candles a cluster must span to be considered meaningful. |
| Cluster Width | Minimum vertical thickness of a cluster in price steps. |
| Zone Smoothing | Adds visual padding to create clean, readable cluster boxes. |
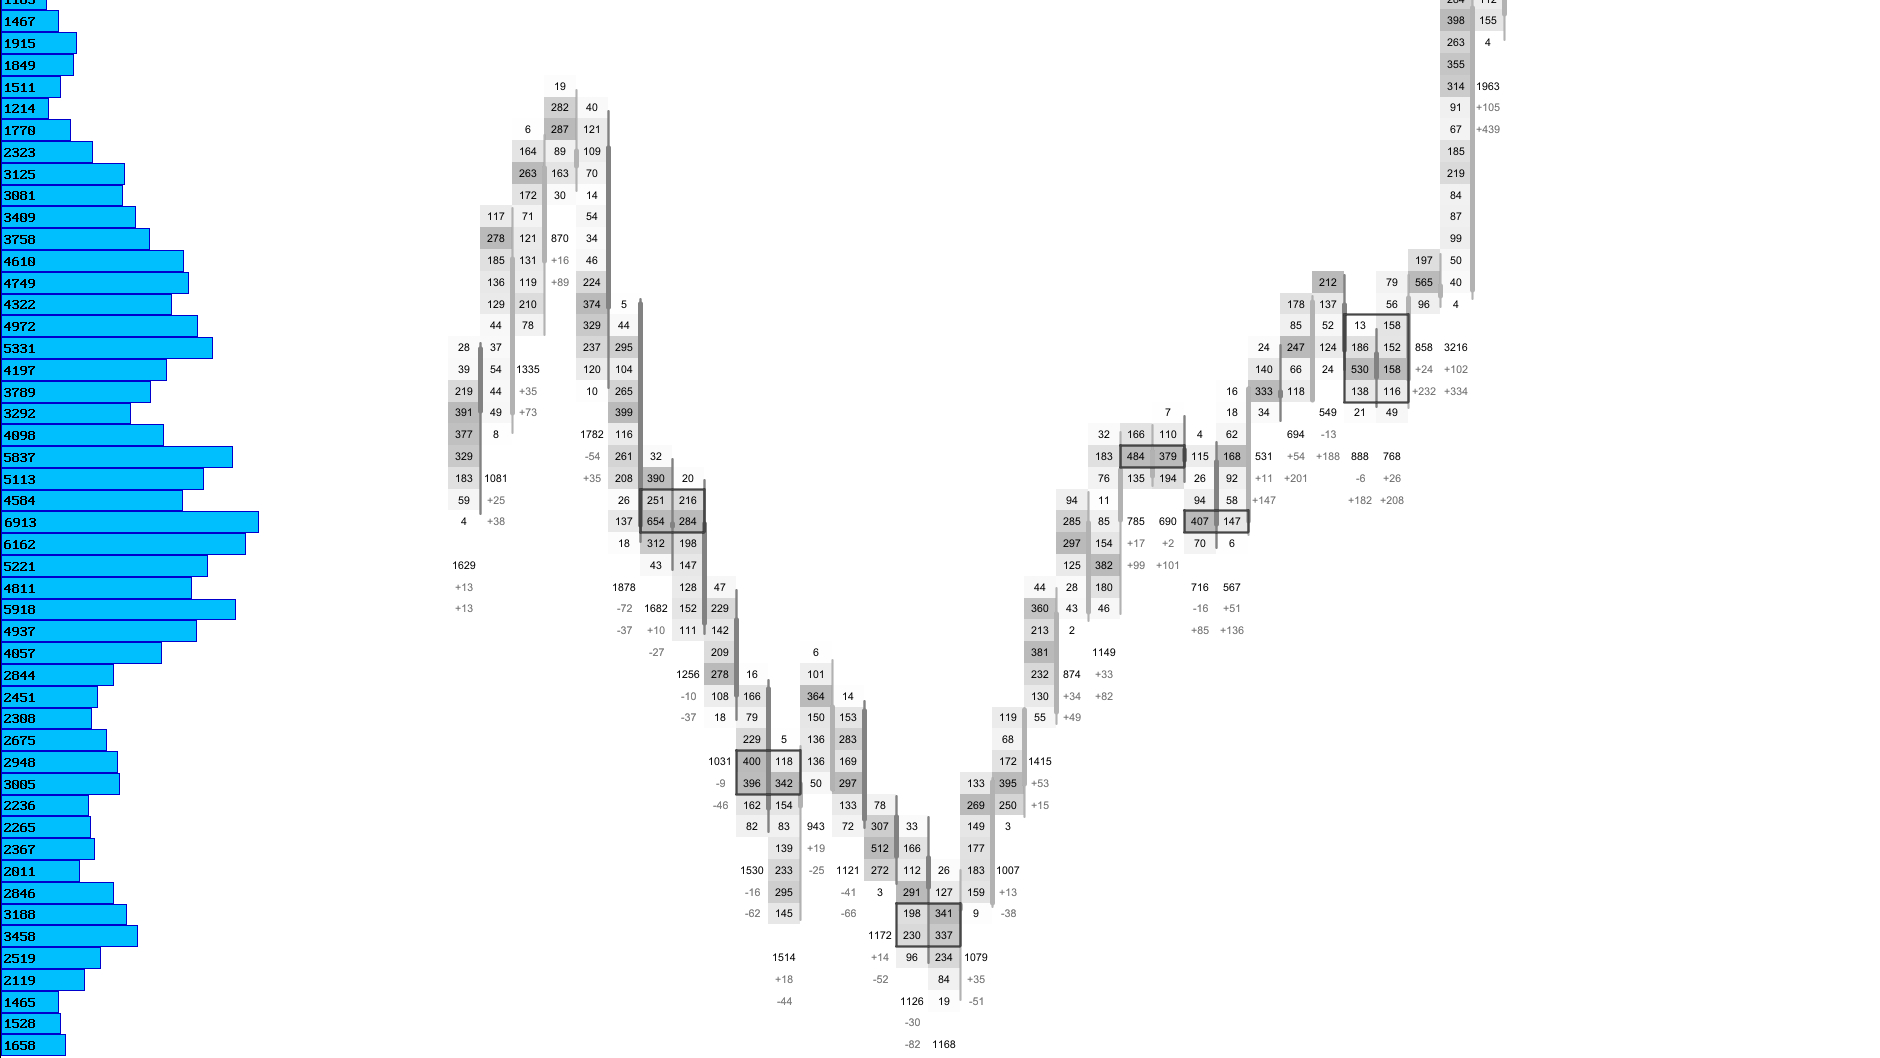
Visual Example: Detection in Action
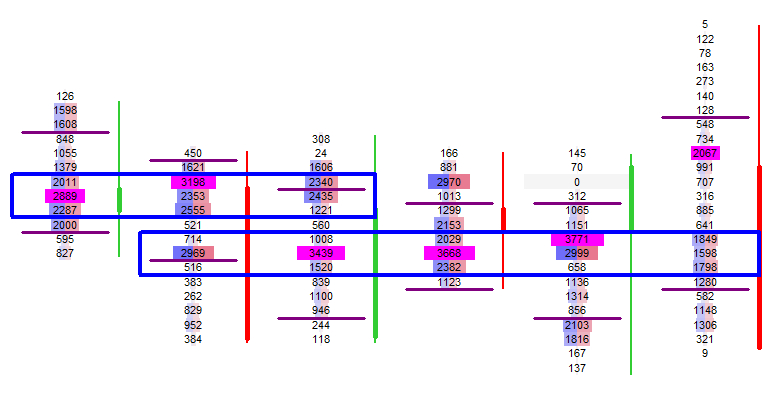
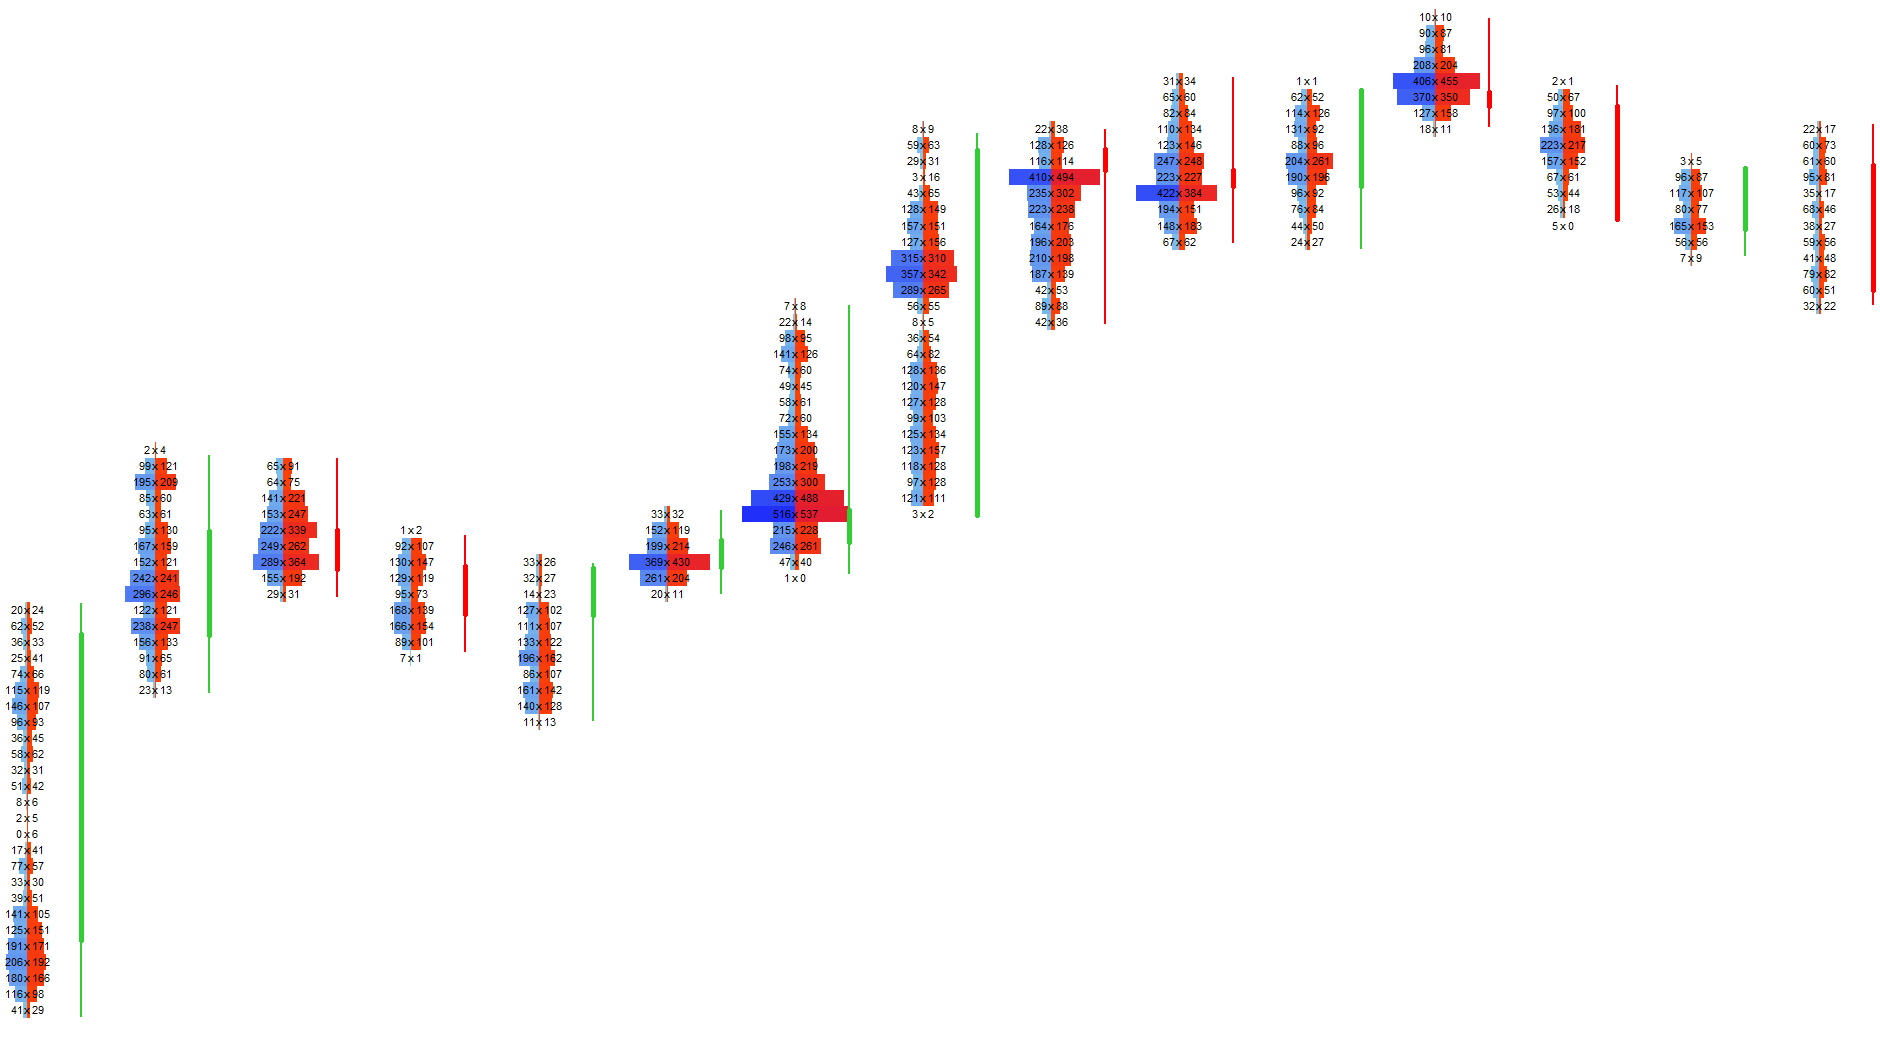
Cluster Zones
Clean structural overlays that highlight meaningful participation.
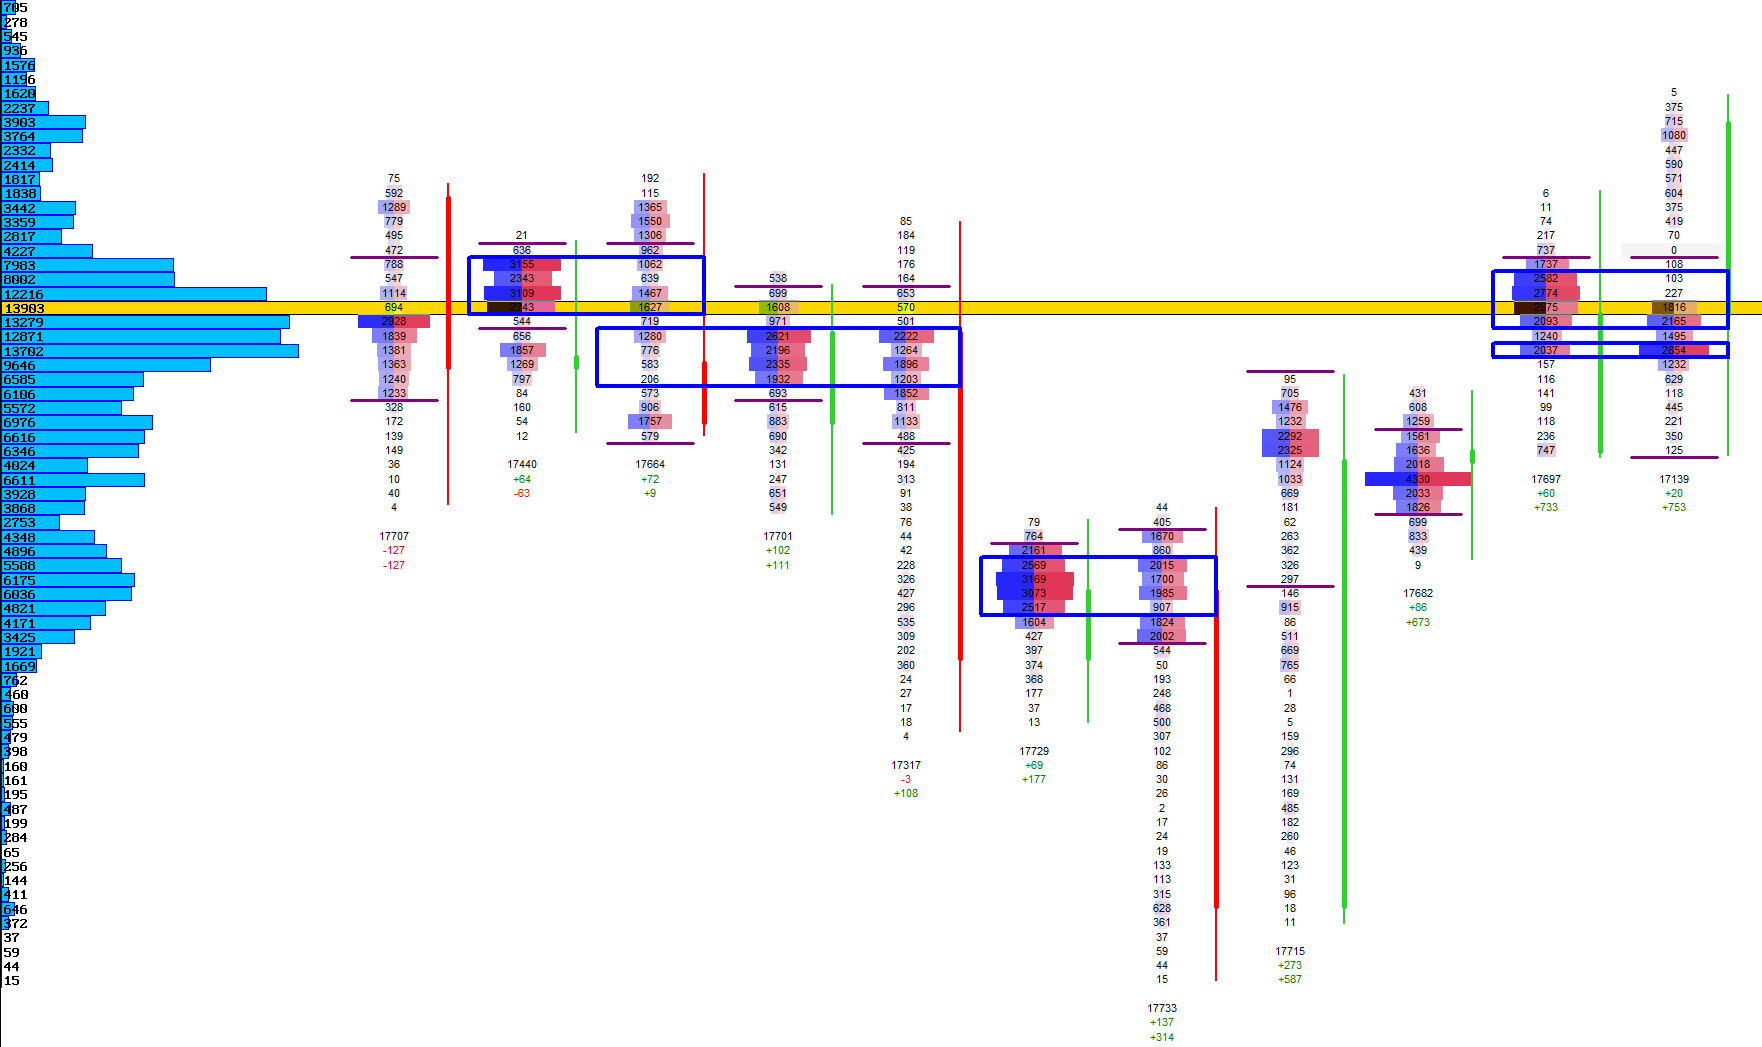
Cluster zones are rectangular overlays drawn around groups of active footprint cells. Each zone spans from the earliest to the latest candle involved and from the lowest to the highest active price level.
These zones provide a clean, structural representation of where the market repeatedly interacted — areas that often act as magnets, barriers or pivot points.
Visual Example: Cluster Zones
Interpreting Clusters
Use clusters as structural context for trade location and risk definition.
Cluster zones often align with areas where the market paused, rotated or repeatedly traded size. They can act as reference regions for potential support or resistance, areas where inventory was built or zones where larger players were active.
Combining clusters with modules such as volume profile, value area or cumulative delta helps distinguish between passive acceptance and aggressive continuation — revealing whether the market is absorbing, building inventory or preparing for a move.
Next Chapters
Continue exploring the core modules of Footprint‑Secrets.