Rejection Signals
Detect aggressive rejection at specific price levels where the auction refuses to continue.
Rejection Signals highlight price levels where one side — buyers or sellers — overwhelms the other so strongly that the market immediately turns away. These moments often mark failed breakouts, exhaustion spikes, or sharp reversals at structural boundaries such as VAH/VAL, LVNs, or previous highs and lows.
Each signal is drawn as a horizontal line with a directional arrow, making it easy to identify where the auction was aggressively rejected and which side was in control.
How Rejection Is Detected
A precise algorithm scanning every footprint price level inside each candle.
Inside every candle, the system evaluates all footprint price buckets and compares bid and ask volume at each level. Only buckets with sufficient activity are considered, using a minimum volume filter relative to the average ticks per bucket.
When one side’s volume exceeds the other by a configurable factor, the bucket is marked as a potential rejection. Neighboring buckets are included to form a cluster, and only the strongest cluster per candle becomes the final rejection signal.
Rejection Modes
| Mode | Description |
|---|---|
| Standard Rejection | Detects aggressive dominance inside a candle based on bid/ask ratios. |
| Volume‑Filtered Rejection | Only triggers when bucket volume exceeds a minimum factor of average activity. |
| Trend‑Filtered Rejection | Confirms signals only when aligned with an EMA‑based trend filter. |
Bullish & Bearish Rejection
Understand which side dominated the auction at the rejected price.
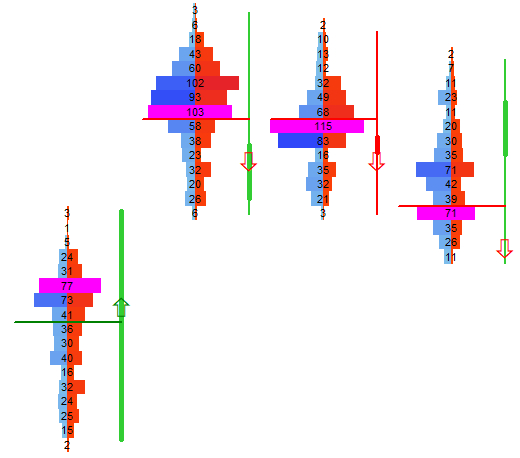
A bullish rejection occurs when aggressive buying overwhelms selling at a price level, forcing the market upward. This often marks failed attempts to push lower or strong absorption by buyers.
A bearish rejection is the opposite: aggressive selling overwhelms buying, rejecting higher prices and often trapping late buyers.
Both types are drawn with directional arrows and dedicated colors for instant recognition.
Rejection Types
| Type | Description |
|---|---|
| Bullish Rejection | Ask volume dominates → arrow points upward. |
| Bearish Rejection | Bid volume dominates → arrow points downward. |
| Neutral Filtered | Signals removed when trend filter invalidates counter‑trend setups. |
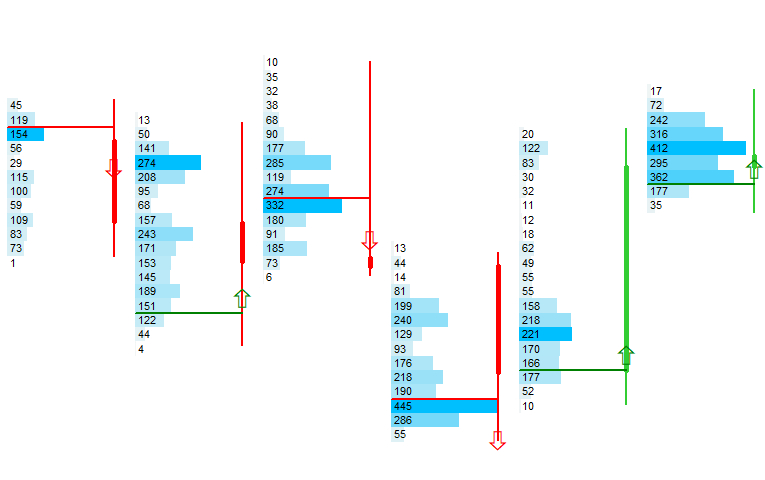
Visual Example: Bullish vs. Bearish Rejection
Trend Filter
Confirm only the strongest signals by aligning them with the prevailing trend.
The optional trend filter uses an EMA to validate rejection signals. Bullish rejections are only confirmed when price closes above the EMA, while bearish rejections require a close below it.
This removes counter‑trend noise and focuses the output on high‑probability continuation setups and pullback entries.
Trend Filter Modes
| Mode | Description |
|---|---|
| Disabled | Shows all rejection signals regardless of trend. |
| EMA‑Aligned | Confirms only signals aligned with the EMA trend direction. |
| Strict Trend Mode | Requires both EMA alignment and minimum volume dominance. |
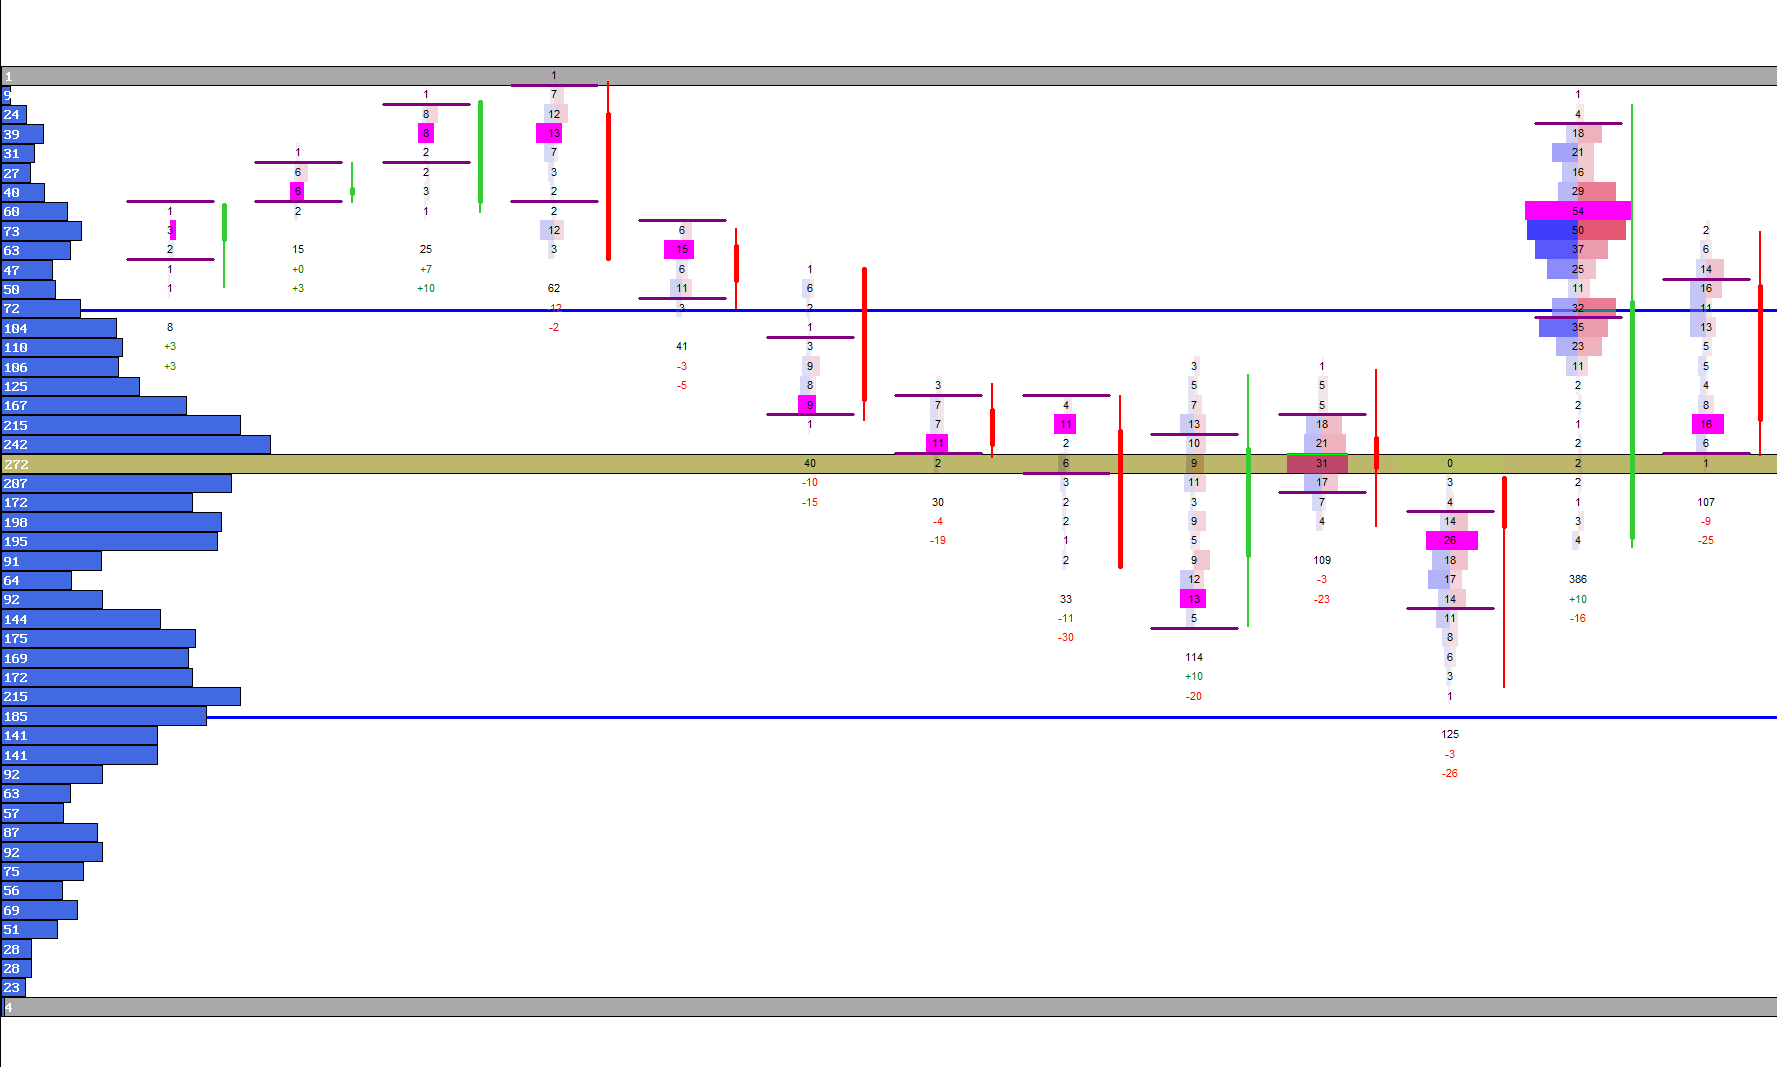
Visual Example: Trend‑Filtered Rejection
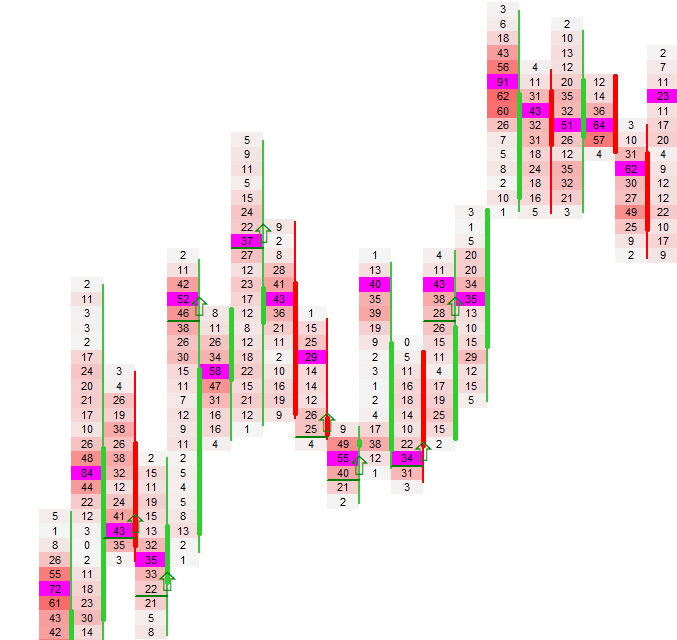
Chart Rendering
Clean, unobtrusive arrows and lines that adapt to zoom, scroll and custom time modes.
Each rejection is drawn as a horizontal line at the rejected price level, with a directional arrow placed slightly above or below it. The renderer automatically adapts to custom time axes, zoom levels and visible ranges.
Old or off‑screen signals are removed automatically, ensuring a clean and responsive chart even during fast markets.
Next Chapters
Continue exploring the core modules of Footprint‑Secrets.