Fight & Calm Zones
Highlight aggressive and passive trading areas inside the footprint.
Fight & Calm Zones reveal where the market becomes unusually active or unusually quiet. They help you instantly see where traders are aggressively competing for control — and where participation drops off and the market becomes passive.
These zones provide a structural layer on top of the footprint, making it easy to identify acceleration, hesitation, absorption, and shifts in participation that often precede meaningful moves.
Fight Zones
Identify areas of aggressive competition and high‑intensity trading.
Fight Zones appear when trading activity at a price level becomes significantly stronger than the surrounding context. These areas often represent moments where buyers and sellers are actively battling for control, creating strong imbalances or rapid shifts in participation.
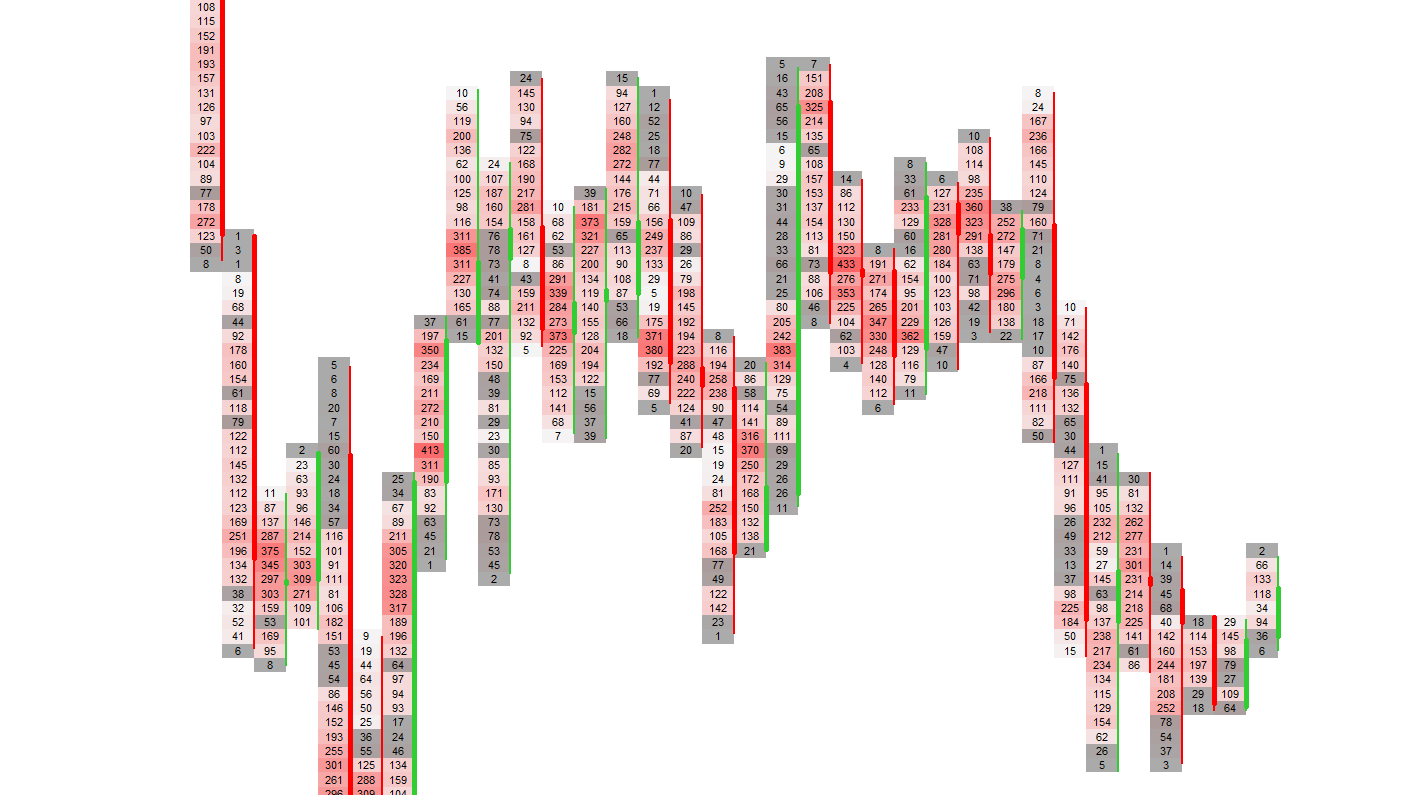
Visually, Fight Zones brighten the footprint and may increase color saturation, making them stand out clearly even inside dense orderflow structures.
Fight Zone Modes
| Mode | Description |
|---|---|
| Activity Spike | Highlights price levels where activity exceeds typical participation. |
| Brightness Boost | Increases brightness to emphasize aggressive competition. |
| Saturation Boost | Enhances color saturation to make high‑intensity zones stand out. |
| Bid/Ask Borders | Optional colored borders reveal directional pressure inside the zone. |
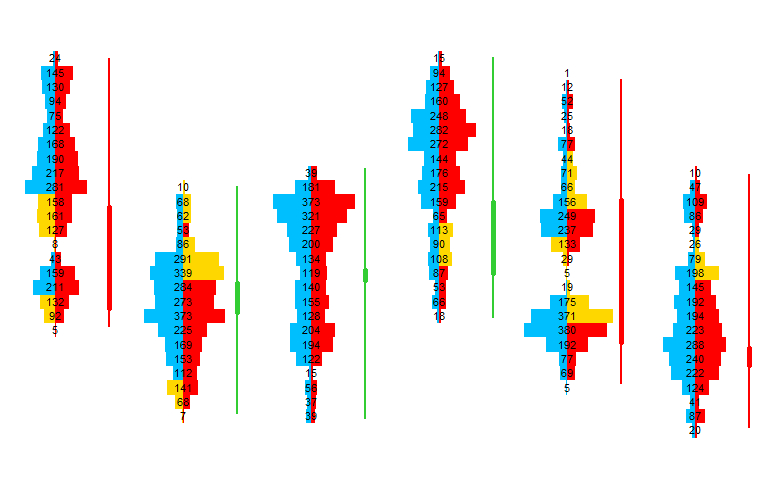
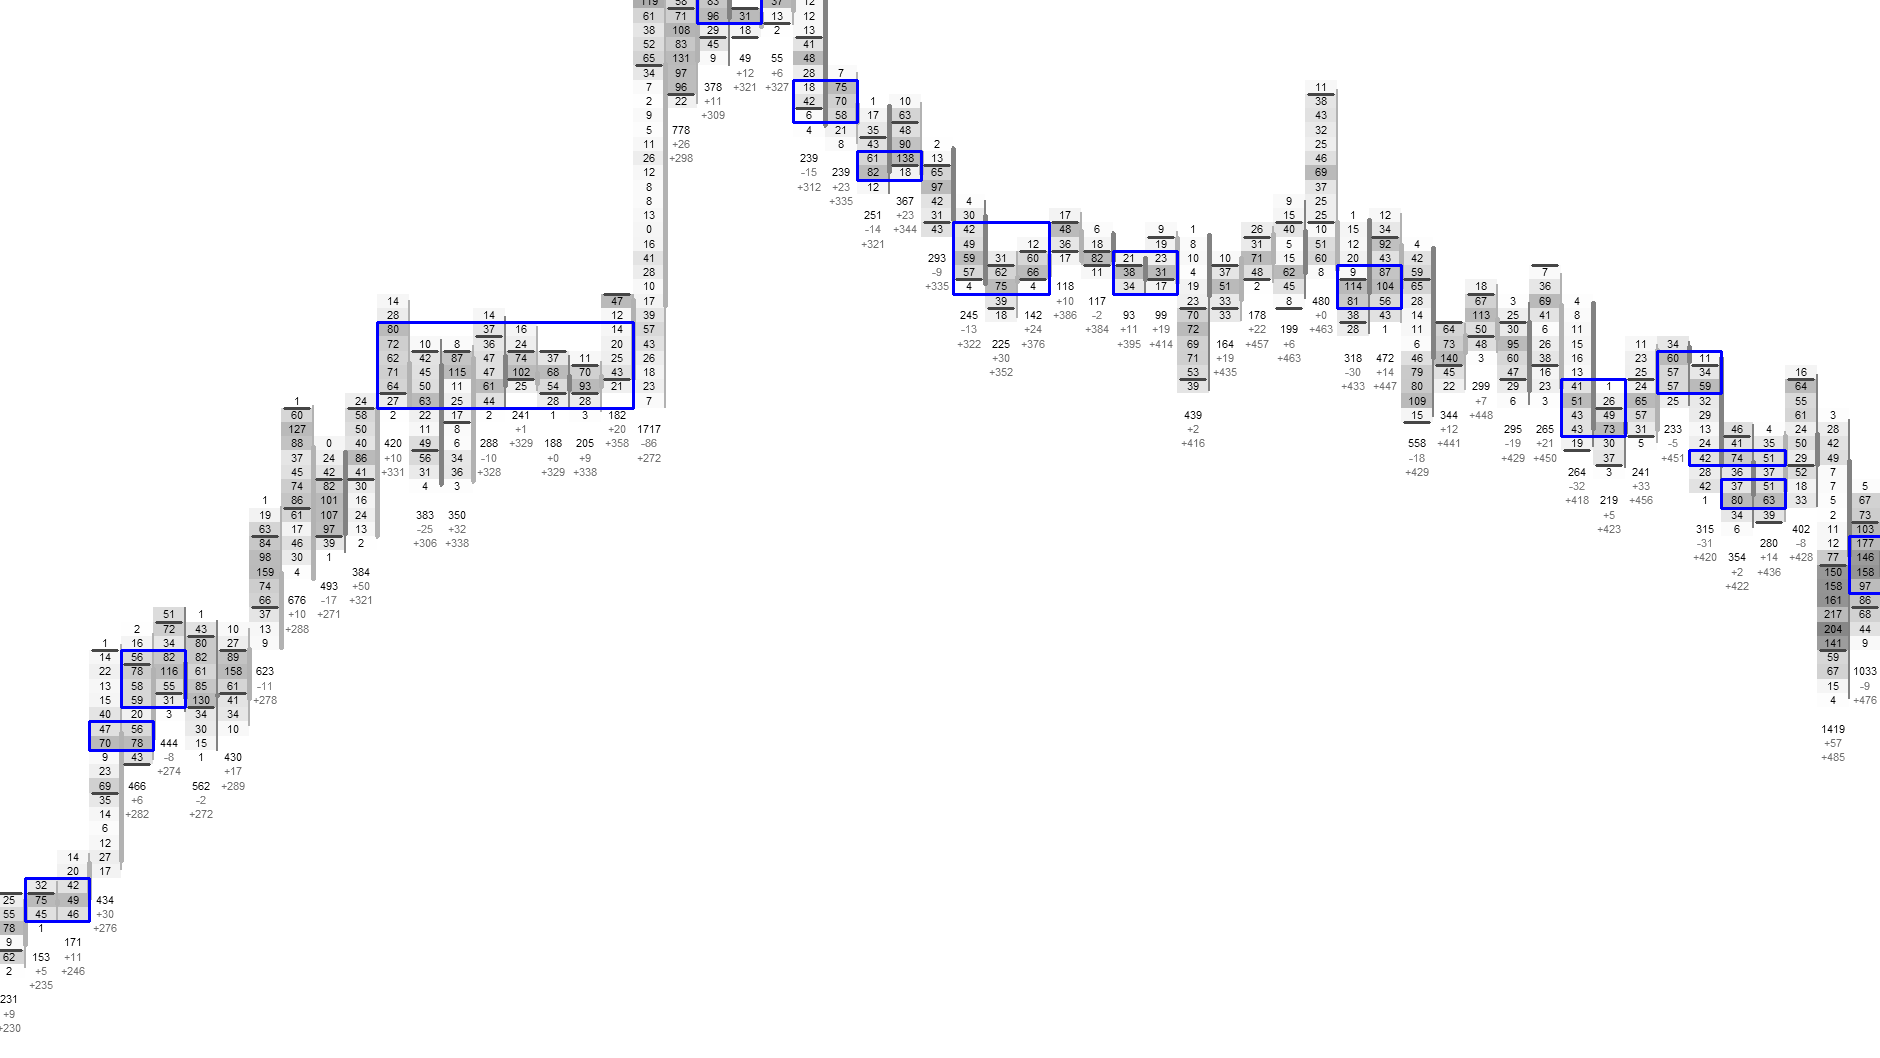
Visual Example: Fight Zones
Calm Zones
Reveal low‑participation areas where the market pauses or loses interest.
Calm Zones highlight price levels where activity drops noticeably below the surrounding structure. These areas often indicate hesitation, absorption or simply a lack of interest from both sides of the market.
The footprint darkens and softens in these regions, helping you visually separate active trading from passive drift or consolidation.
Calm Zone Modes
| Mode | Description |
|---|---|
| Low‑Activity Detection | Marks price levels where participation falls below typical activity. |
| Darken | Softens and darkens the footprint to indicate passive behavior. |
| Desaturate | Reduces color saturation to visually separate calm regions. |
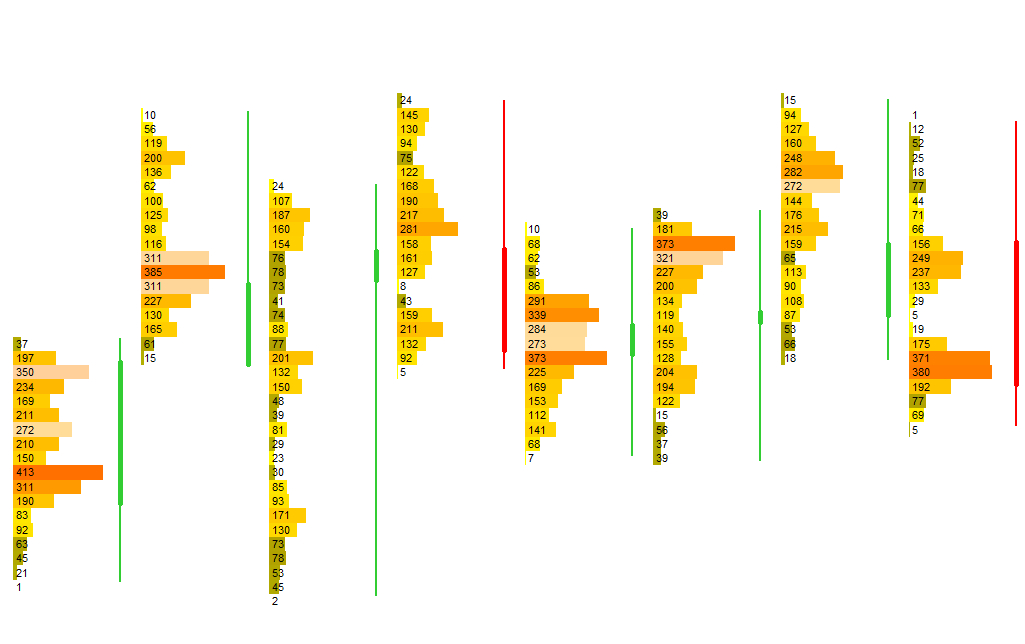
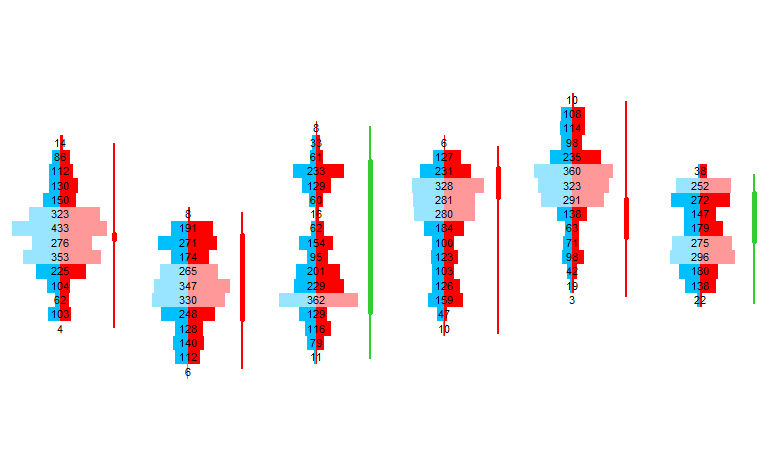
Visual Example: Calm Zones
Interpreting Fight & Calm Zones
Structural context for trade location and risk definition.
Fight Zones often align with areas where the market paused, rotated or repeatedly traded size. They can mark potential breakout points, defended levels or regions of aggressive competition.
Calm Zones highlight hesitation, absorption or low‑interest regions. These areas often precede rotations, consolidations or failed moves.
Combining Fight & Calm Zones with modules such as volume profile, value area or cumulative delta helps distinguish between passive acceptance and aggressive continuation — revealing whether the market is preparing for expansion or losing momentum.
Next Chapters
Continue exploring advanced orderflow modules.